Kroger 2012 Annual Report Download - page 35
Download and view the complete annual report
Please find page 35 of the 2012 Kroger annual report below. You can navigate through the pages in the report by either clicking on the pages listed below, or by using the keyword search tool below to find specific information within the annual report.-
 1
1 -
2
-
3
-
4
-
5
-
6
-
7
-
8
-
9
-
10
-
11
-
12
-
13
-
14
-
15
-
16
-
17
-
18
-
19
-
20
-
21
-
22
-
23
-
24
-
 25
25 -
 26
26 -
 27
27 -
 28
28 -
 29
29 -
 30
30 -
 31
31 -
 32
32 -
 33
33 -
 34
34 -
 35
35 -
 36
36 -
 37
37 -
 38
38 -
 39
39 -
 40
40 -
 41
41 -
 42
42 -
 43
43 -
 44
44 -
 45
45 -
46
-
47
-
48
-
49
-
50
-
51
-
52
-
53
-
54
-
55
-
56
-
57
-
58
-
59
-
60
-
61
-
62
-
63
-
64
-
65
-
66
-
67
-
68
-
69
-
70
-
71
-
72
-
73
-
74
-
75
-
76
-
77
-
78
-
79
-
80
-
81
-
82
-
83
-
84
-
85
-
86
-
87
-
88
-
89
-
90
-
91
-
92
-
93
-
94
-
95
-
96
-
97
-
98
-
99
-
100
-
101
-
102
-
103
-
104
-
105
-
106
-
107
-
108
-
109
-
110
-
111
-
112
-
113
-
114
-
115
-
116
-
117
-
118
-
119
-
120
-
121
-
122
-
123
-
124
-
125
-
126
-
127
-
128
-
129
-
130
-
131
-
132
-
133
-
134
-
135
-
136
 |
 |

33
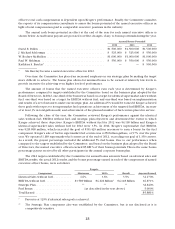
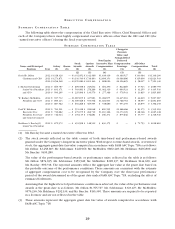
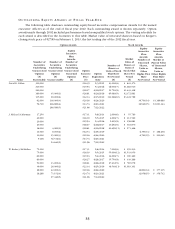
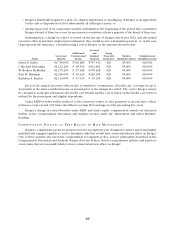
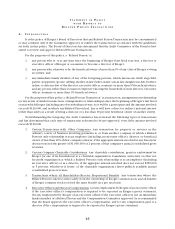
OU T S T A N D I N G E Q U I T Y A WA R D S A T F I S C A L Y E A R - E N D
The following table discloses outstanding equity-based incentive compensation awards for the named
executive officers as of the end of fiscal year 2012. Each outstanding award is shown separately. Option
awardsmadethrough2002includedperformance-basednonqualifiedstockoptions.Thevestingschedulefor
eachawardisdescribedinthefootnotestothistable.MarketvalueofunvestedsharesisbasedonKroger’s
closingstockpriceof$27.89onFebruary1,2013,thelasttradingdayofthe2012fiscalyear.
Option Awards Stock Awards
Name
Number of
Securities
Underlying
Unexercised
Options
(#)
Exercisable
Number of
Securities
Underlying
Unexercised
Options
(#)
Unexercisable
Equity
Incentive
Plan
Awards:
Number of
Securities
Underlying
Unexercised
Unearned
Options
(#)
Option
Exercise
Price
($)
Option
Expiration
Date
Number of
Shares or
Units of Stock
That Have
Not Vested
(#)
Market
Value of
Shares or
Units of
Stock That
Have Not
Vested
($)
Equity
Incentive
Plan
Awards:
Number of
Unearned
Shares,
Units or
Other
Rights That
Have
Not Vested
Equity
Incentive
Plan
Awards:
Market or
Payout Value
of Unearned
Shares,
Units or
Other Rights
That Have
Not Vested
David B. Dillon 300,000 $16.39 5/5/2015 23,000(6) $ 641,470
240,000 $19.94 5/4/2016 46,000(7) $1,282,940
220,000 $28.27 6/28/2017 51,750(8) $1,443,308
180,000 45,000(1) $28.61 6/26/2018 85,080(9) $2,372,881
135,000 90,000(2) $22.34 6/25/2019 111,968(10) $3,122,788
92,000 138,000(3) $20.16 6/24/2020 39,704(14) $1,169,680
56,720 226,880(4) $24.74 6/23/2021 36,949(15) $1,093,144
298,580(5) $21.96 7/12/2022
J.MichaelSchlotman 17,250 $17.31 5/6/2014 2,000(6) $ 55,780
40,000 $16.39 5/5/2015 4,000(7) $ 111,560
20,000 $19.94 5/4/2016 5,625(8) $ 156,881
20,000 $28.27 6/28/2017 13,692(9) $ 381,870
16,000 4,000(1) $28.61 6/26/2018 20,490(11) $ 571,466
12,000 8,000(2) $22.34 6/25/2019 6,390(14) $ 188,238
10,000 15,000(3) $20.16 6/24/2020 6,762(15) $ 200,045
9,128 36,512(4) $24.74 6/23/2021
54,640(5) $21.96 7/12/2022
W.RodneyMcMullen 75,000 $17.31 5/6/2014 7,000(6) $ 195,230
75,000 $16.39 5/5/2015 55,000(12) $1,533,950
60,000 $19.94 5/4/2016 14,000(7) $ 390,460
60,000 $28.27 6/28/2017 15,750(8) $ 439,268
52,000 13,000(1) $28.61 6/26/2018 27,432(9) $ 765,078
39,000 26,000(2) $22.34 6/25/2019 36,540(11) $1,019,101
28,000 42,000(3) $20.16 6/24/2020 12,802(14) $ 377,135
18,288 73,152(4) $24.74 6/23/2021 12,058(15) $ 356,742
97,440(5) $21.96 7/12/2022