Kroger 2012 Annual Report Download - page 31
Download and view the complete annual report
Please find page 31 of the 2012 Kroger annual report below. You can navigate through the pages in the report by either clicking on the pages listed below, or by using the keyword search tool below to find specific information within the annual report.-
 1
1 -
2
-
3
-
4
-
5
-
6
-
7
-
8
-
9
-
10
-
11
-
12
-
13
-
14
-
15
-
16
-
17
-
18
-
19
-
20
-
 21
21 -
 22
22 -
 23
23 -
 24
24 -
 25
25 -
 26
26 -
 27
27 -
 28
28 -
 29
29 -
 30
30 -
 31
31 -
 32
32 -
 33
33 -
 34
34 -
 35
35 -
 36
36 -
 37
37 -
 38
38 -
 39
39 -
 40
40 -
 41
41 -
42
-
43
-
44
-
45
-
46
-
47
-
48
-
49
-
50
-
51
-
52
-
53
-
54
-
55
-
56
-
57
-
58
-
59
-
60
-
61
-
62
-
63
-
64
-
65
-
66
-
67
-
68
-
69
-
70
-
71
-
72
-
73
-
74
-
75
-
76
-
77
-
78
-
79
-
80
-
81
-
82
-
83
-
84
-
85
-
86
-
87
-
88
-
89
-
90
-
91
-
92
-
93
-
94
-
95
-
96
-
97
-
98
-
99
-
100
-
101
-
102
-
103
-
104
-
105
-
106
-
107
-
108
-
109
-
110
-
111
-
112
-
113
-
114
-
115
-
116
-
117
-
118
-
119
-
120
-
121
-
122
-
123
-
124
-
125
-
126
-
127
-
128
-
129
-
130
-
131
-
132
-
133
-
134
-
135
-
136
 |
 |

29
EX E C U T I V E C O M P E N S A T I O N
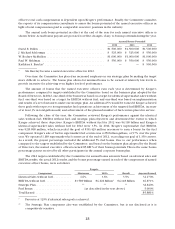
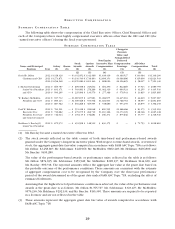
SU M M A R Y C O M P E N S A T I O N T A B L E
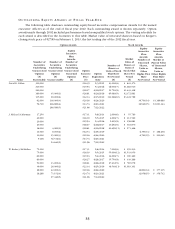
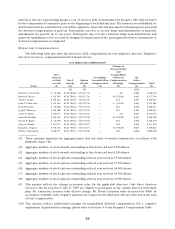
The following table shows the compensation of the Chief Executive Officer, Chief Financial Officer and
eachoftheCompany’sthreemosthighlycompensatedexecutiveofficersotherthantheCEOandCFO(the
“namedexecutiveofficers”)duringthefiscalyearspresented:
SU M M A R Y C O M P E N S A T I O N T A B L E
Name and Principal
Position Year
Salary
($)
Bonus
($)
Stock
Awards
($)
Option
Awards
($)
Non-Equity
Incentive Plan
Compensation
($)
Change in
Pension
Value and
Nonqualified
Deferred
Compensation
Earnings
($)
All Other
Compensation
($)
Total
($)
(2) (3) (4) (5) (6)
David B. Dillon 2012 $1,328,320 — $3,332,852 $1,342,088 $1,619,419 $3,380,527 $143,084 $11,146,290
Chairman and CEO 2011 $1,273,871 — $3,130,540 $1,716,693 $2,699,153 $3,088,686 $115,600 $12,024,543
2010 $1,256,548 — $2,070,880 $1,201,240 $ 808,020 $2,156,625 $ 58,027 $ 7,551,340
J.MichaelSchlotman 2012 $ 669,787 — $ 609,908 $ 245,602 $ 604,250 $ 822,669 $ 37,543 $ 2,989,759
Senior Vice President 2011 $ 631,371 — $ 503,801 $ 276,269 $1,002,310 $ 990,524 $ 31,255 $ 3,435,530
and CFO 2010 $ 590,295 — $ 225,096 $ 130,570 $ 277,368 $ 578,541 $ 13,815 $ 1,815,685
W.RodneyMcMullen 2012 $ 937,732 — $1,087,655 $ 437,983 $1,084,975 $1,415,003 $ 44,619 $ 5,007,967
President and COO 2011 $ 899,113 — $1,009,368 $ 553,506 $1,821,903 $1,768,792 $ 38,957 $ 6,091,639
2010 $ 887,562 — $ 630,268 $ 365,595 $ 538,680 $ 953,159 $ 20,875 $ 3,396,139
Paul W. Heldman 2012 $ 761,501 — $ 551,418 $ 222,048 $ 650,595 $1,266,466 $ 83,175 $ 3,535,203
Executive Vice 2011 $ 730,682 — $ 479,075 $ 262,710 $1,110,126 $1,374,309 $ 68,346 $ 4,025,248
President, Secretary 2010 $ 716,044 — $ 270,115 $ 156,684 $ 296,274 $ 875,646 $ 33,777 $ 2,348,540
andGeneralCounsel
Kathleen S. Barclay(1) 2012 $ 675,972 — $ 491,998 $ 148,512 $ 630,375 $ — $ 71,753 $ 2,018,610
Senior Vice President
(1) Ms.Barclaybecameanamedexecutiveofficerin2012.
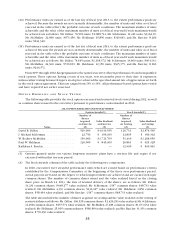
(2) The stock awards reflected in the table consist of both time-based and performance-based awards
granted under the Company’s long-term incentive plans. With respect to time-based awards, or restricted
stock,theaggregategrantdatefairvaluecomputedinaccordancewithFASBASCTopic718isasfollows:
Mr.Dillon:$2,458,817;Mr.Schlotman:$449,960;Mr.McMullen:$802,418;Mr.Heldman:$406,809,and
Ms.Barclay:$395,280.
Thevalueoftheperformance-basedawards,orperformanceunits,reflectedinthetableisasfollows:
Mr.Dillon:$874,035;Mr.Schlotman:$159,948;Mr.McMullen:$285,237;Mr.Heldman:$144,609;and
Ms.Barclay:$96,718.Thereportedamountsreflecttheaggregatefairvalueatthegrantdatebasedon
the probable outcome of the performance conditions. These amounts are consistent with the estimate
of aggregate compensation cost to be recognized by the Company over the three-year performance
period of the award determined as of the grant date under FASB ASC Topic 718, excluding the effect of
estimated forfeitures.
Assuming that the highest level of performance conditions is achieved, the value of the performance unit
awardsatthegrantdateisasfollows:Mr.Dillon$1,765,727;Mr.Schlotman:$323,127;Mr.McMullen:
$576,236;Mr.Heldman:$292,139,andMs.Barclay:$195,390.Theseamountsarerequiredtobereported
in a footnote and are not reflected in the table.
(3) Theseamountsrepresenttheaggregategrantdatefairvalueofawardscomputedinaccordancewith
FASB ASC Topic 718.