Kroger 2012 Annual Report Download - page 102
Download and view the complete annual report
Please find page 102 of the 2012 Kroger annual report below. You can navigate through the pages in the report by either clicking on the pages listed below, or by using the keyword search tool below to find specific information within the annual report.-
 1
1 -
2
-
3
-
4
-
5
-
6
-
7
-
8
-
9
-
10
-
11
-
12
-
13
-
14
-
15
-
16
-
17
-
18
-
19
-
20
-
21
-
22
-
23
-
24
-
25
-
26
-
27
-
28
-
29
-
30
-
31
-
32
-
33
-
34
-
35
-
36
-
37
-
38
-
39
-
40
-
41
-
42
-
43
-
44
-
45
-
46
-
47
-
48
-
49
-
50
-
51
-
52
-
53
-
54
-
55
-
56
-
57
-
58
-
59
-
60
-
61
-
62
-
63
-
64
-
65
-
66
-
67
-
68
-
69
-
70
-
71
-
72
-
73
-
74
-
75
-
76
-
77
-
78
-
79
-
80
-
81
-
82
-
83
-
84
-
85
-
86
-
87
-
88
-
89
-
90
-
91
-
 92
92 -
 93
93 -
 94
94 -
 95
95 -
 96
96 -
 97
97 -
 98
98 -
 99
99 -
 100
100 -
 101
101 -
 102
102 -
 103
103 -
 104
104 -
 105
105 -
 106
106 -
 107
107 -
 108
108 -
 109
109 -
 110
110 -
 111
111 -
 112
112 -
113
-
114
-
115
-
116
-
117
-
118
-
119
-
120
-
121
-
122
-
123
-
124
-
125
-
126
-
127
-
128
-
129
-
130
-
131
-
132
-
133
-
134
-
135
-
136
 |
 |

A-44
NO T E S T O C O N S O L I D A T E D F I N A N C I A L S T A T E M E N T S , CO N T I N U E D
Segments
The Company operates retail food and drug stores, multi-department stores, jewelry stores, and
convenience stores throughout the United States. The Company’s retail operations, which represent over
99% of the Company’s consolidated sales and EBITDA, are its only reportable segment. The Company’s retail
operating divisions have been aggregated into one reportable segment due to the operating divisions having
similar economic characteristics with similar long-term financial performance. In addition, the Company’s
operating divisions offer to its customers similar products, have similar distribution methods, operate in
similar regulatory environments, purchase the majority of the Company’s merchandise for retail sale from
similar (and in many cases identical) vendors on a coordinated basis from a centralized location, serve similar
types of customers, and are allocated capital from a centralized location. The Company’s operating divisions
reflect the manner in which the business is managed and how the Company’s Chief Executive Officer and
Chief Operating Officer, who act as the Company’s chief operating decision makers, assess performance
internally. All of the Company’s operations are domestic.
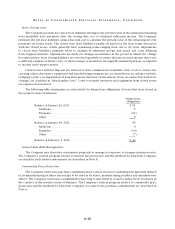
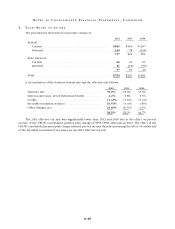
The following table presents sales revenue by type of product for 2012, 2011 and 2010.
2012 2011 2010
Amount % of total Amount % of total Amount % of total
Non Perishable (1) ............ $48,663 50.3% $46,494 51.4% $44,615 54.4%
Perishable (2) ............... 19,893 20.6% 18,693 20.7% 17,532 21.4%
Fuel ....................... 18,896 19.5% 16,901 18.7% 12,081 14.7%
Pharmacy .................. 8,018 8.3% 7,322 8.1% 6,929 8.4%
Other (3) ................... 1,281 1.3% 964 1.1% 892 1.1%
Total Sales and other revenue ... $96,751 100.0% $90,374 100.0% $82,049 100.0%
(1) Consists primarily of grocery, general merchandise, health and beauty care and natural foods.
(2) Consists primarily of produce, floral, meat, seafood, deli and bakery.
(3) Consists primarily of jewelry store sales, outside manufacturing sales and sales from entities not
controlled by the Company.
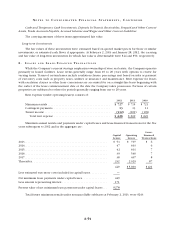
2 . G O O D W I L L
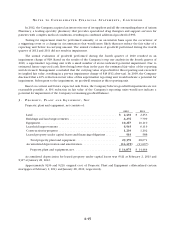
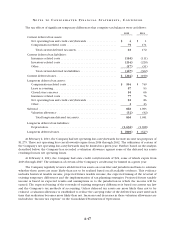
The following table summarizes the changes in the Company’s net goodwill balance through
February 2, 2013.
2012 2011
Balance beginning of year
Goodwill ................................................ $ 3,670 $ 3,672
Accumulated impairment losses .............................. (2,532) (2,532)
1,138 1,140
Activity during the year
Acquisitions .............................................. 96 —
Disposition ............................................... —(2)
Balance end of year
Goodwill ................................................ 3,766 3,670
Accumulated impairment losses .............................. (2,532) (2,532)
$ 1,234 $ 1,138