Kroger 2012 Annual Report Download - page 67
Download and view the complete annual report
Please find page 67 of the 2012 Kroger annual report below. You can navigate through the pages in the report by either clicking on the pages listed below, or by using the keyword search tool below to find specific information within the annual report.-
 1
1 -
2
-
3
-
4
-
5
-
6
-
7
-
8
-
9
-
10
-
11
-
12
-
13
-
14
-
15
-
16
-
17
-
18
-
19
-
20
-
21
-
22
-
23
-
24
-
25
-
26
-
27
-
28
-
29
-
30
-
31
-
32
-
33
-
34
-
35
-
36
-
37
-
38
-
39
-
40
-
41
-
42
-
43
-
44
-
45
-
46
-
47
-
48
-
49
-
50
-
51
-
52
-
53
-
54
-
55
-
56
-
 57
57 -
 58
58 -
 59
59 -
 60
60 -
 61
61 -
 62
62 -
 63
63 -
 64
64 -
 65
65 -
 66
66 -
 67
67 -
 68
68 -
 69
69 -
 70
70 -
 71
71 -
 72
72 -
 73
73 -
 74
74 -
 75
75 -
 76
76 -
 77
77 -
78
-
79
-
80
-
81
-
82
-
83
-
84
-
85
-
86
-
87
-
88
-
89
-
90
-
91
-
92
-
93
-
94
-
95
-
96
-
97
-
98
-
99
-
100
-
101
-
102
-
103
-
104
-
105
-
106
-
107
-
108
-
109
-
110
-
111
-
112
-
113
-
114
-
115
-
116
-
117
-
118
-
119
-
120
-
121
-
122
-
123
-
124
-
125
-
126
-
127
-
128
-
129
-
130
-
131
-
132
-
133
-
134
-
135
-
136
 |
 |

A-9
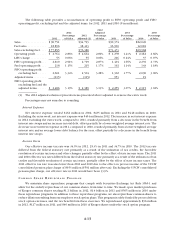
Sales
Total Sales
(in millions)
2012
2012
Adjusted (2)
Percentage
Increase (3) 2011
Percentage
Increase (4) 2010
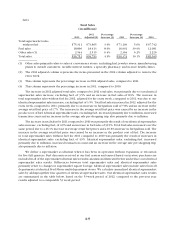
Total supermarket sales
without fuel . . . . . . . . . . . . . . . . . . . $75,311 $73,865 3.9% $ 71,109 5.0% $67,742
Fuel sales . . . . . . . . . . . . . . . . . . . . . . . . 18,896 18,413 8.9% 16,901 39.9% 12,081
Other sales (1) . . . . . . . . . . . . . . . . . . . . 2,544 2,515 6.4% 2,364 6.2% 2,226
Total sales . . . . . . . . . . . . . . . . . . . . . . . $96,751 $94,793 4.9% $ 90,374 10.1% $ 82,049
(1) Other sales primarily relate to sales at convenience stores, excluding fuel; jewelry stores; manufacturing
plants to outside customers; variable interest entities; a specialty pharmacy; and in-store health clinics.
(2) The 2012 adjusted column represents the items presented in the 2012 column adjusted to remove the
extra week.
(3) This column represents the percentage increase in 2012 adjusted sales, compared to 2011.
(4) This column represents the percentage increase in 2011, compared to 2010.
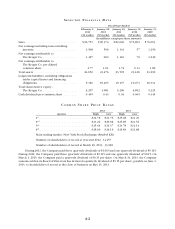
The increase in 2012 adjusted total sales, compared to 2011 total sales, was primarily due to our identical
supermarket sales increase, excluding fuel, of 3.5% and an increase in fuel sales of 8.9%. The increase in
total supermarket sales without fuel for 2012, adjusted for the extra week, compared to 2011, was due to our
identical supermarket sales increase, excluding fuel of 3.5%. Total fuel sales increased in 2012, adjusted for the
extra week, compared to 2011, primarily due to an increase in fuel gallons sold of 7.8% and an increase in the
average retail fuel price of 1.7%. The increase in the average retail fuel price was caused by an increase in the
product cost of fuel. Identical supermarket sales, excluding fuel, increased primarily due to inflation, increased
transaction count and an increase in the average sale per shopping trip, also primarily due to inflation.
The increase in total sales for 2011 compared to 2010 was primarily the result of our identical supermarket
sales increase, excluding fuel, of 4.9% and an increase in fuel sales of 39.9%. Total fuel sales increased over the
same period due to a 26.3% increase in average retail fuel prices and a 10.8% increase in fuel gallons sold. The
increase in the average retail fuel price was caused by an increase in the product cost of fuel. The increase
in total supermarket sales without fuel for 2011 compared to 2010 was primarily the result of increases in
identical supermarket sales, excluding fuel, of 4.9%. Identical supermarket sales, excluding fuel, increased
primarily due to inflation, increased transaction count and an increase in the average sale per shopping trip,
also primarily due to inflation.
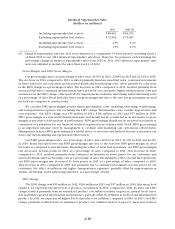
We define a supermarket as identical when it has been in operation without expansion or relocation
for five full quarters. Fuel discounts received at our fuel centers and earned based on in-store purchases are
included in all of the supermarket identical sales results calculations illustrated below and reduce our identical
supermarket sales results. Differences between total supermarket sales and identical supermarket sales
primarily relate to changes in supermarket square footage. Identical supermarket sales include sales from all
departments at identical Fred Meyer multi-department stores. We calculate annualized identical supermarket
sales by adding together four quarters of identical supermarket sales. Our identical supermarket sales results
are summarized in the table below, based on the 53-week period of 2012, compared to the previous year
results adjusted to a comparable 53 week period.