Kroger 2012 Annual Report Download - page 126
Download and view the complete annual report
Please find page 126 of the 2012 Kroger annual report below. You can navigate through the pages in the report by either clicking on the pages listed below, or by using the keyword search tool below to find specific information within the annual report.-
 1
1 -
2
-
3
-
4
-
5
-
6
-
7
-
8
-
9
-
10
-
11
-
12
-
13
-
14
-
15
-
16
-
17
-
18
-
19
-
20
-
21
-
22
-
23
-
24
-
25
-
26
-
27
-
28
-
29
-
30
-
31
-
32
-
33
-
34
-
35
-
36
-
37
-
38
-
39
-
40
-
41
-
42
-
43
-
44
-
45
-
46
-
47
-
48
-
49
-
50
-
51
-
52
-
53
-
54
-
55
-
56
-
57
-
58
-
59
-
60
-
61
-
62
-
63
-
64
-
65
-
66
-
67
-
68
-
69
-
70
-
71
-
72
-
73
-
74
-
75
-
76
-
77
-
78
-
79
-
80
-
81
-
82
-
83
-
84
-
85
-
86
-
87
-
88
-
89
-
90
-
91
-
92
-
93
-
94
-
95
-
96
-
97
-
98
-
99
-
100
-
101
-
102
-
103
-
104
-
105
-
106
-
107
-
108
-
109
-
110
-
111
-
112
-
113
-
114
-
115
-
 116
116 -
 117
117 -
 118
118 -
 119
119 -
 120
120 -
 121
121 -
 122
122 -
 123
123 -
 124
124 -
 125
125 -
 126
126 -
 127
127 -
 128
128 -
 129
129 -
 130
130 -
 131
131 -
 132
132 -
 133
133 -
 134
134 -
 135
135 -
 136
136
 |
 |
A-68
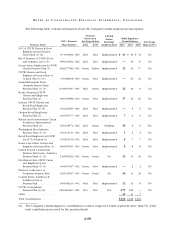
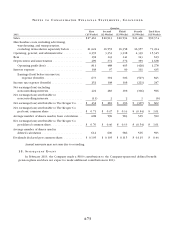
NO T E S T O C O N S O L I D A T E D F I N A N C I A L S T A T E M E N T S , CO N T I N U E D
c. If the Company stops participating in some of its multi-employer pension plans, the Company may
be required to pay those plans an amount based on its allocable share of the underfunded status of
the plan, referred to as a withdrawal liability.
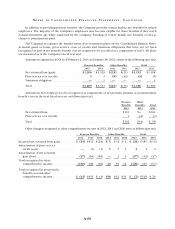
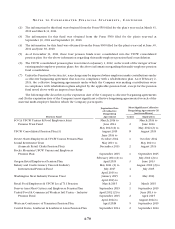
The Company’s participation in these plans is outlined in the following tables. The EIN / Pension Plan
Number column provides the Employer Identification Number (“EIN”) and the three-digit pension plan
number. The most recent Pension Protection Act Zone Status available in 2012 and 2011 is for the plan’s
year-end at December 31, 2011 and December 31, 2010, respectively. Among other factors, generally, plans in
the red zone are less than 65 percent funded, plans in the yellow zone are less than 80 percent funded and
plans in the green zone are at least 80 percent funded. The FIP/RP Status Pending / Implemented Column
indicates plans for which a funding improvement plan (“FIP”) or a rehabilitation plan (“RP”) is either pending
or has been implemented. Unless otherwise noted, the information for these tables was obtained from the
Forms 5500 filed for each plan’s year-end at December 31, 2011 and December 31, 2010. The multi-employer
contributions listed in the table below are the Company’s multi-employer contributions made in fiscal years
2012, 2011 and 2010.