Kroger 2012 Annual Report Download - page 71
Download and view the complete annual report
Please find page 71 of the 2012 Kroger annual report below. You can navigate through the pages in the report by either clicking on the pages listed below, or by using the keyword search tool below to find specific information within the annual report.-
 1
1 -
2
-
3
-
4
-
5
-
6
-
7
-
8
-
9
-
10
-
11
-
12
-
13
-
14
-
15
-
16
-
17
-
18
-
19
-
20
-
21
-
22
-
23
-
24
-
25
-
26
-
27
-
28
-
29
-
30
-
31
-
32
-
33
-
34
-
35
-
36
-
37
-
38
-
39
-
40
-
41
-
42
-
43
-
44
-
45
-
46
-
47
-
48
-
49
-
50
-
51
-
52
-
53
-
54
-
55
-
56
-
57
-
58
-
59
-
60
-
 61
61 -
 62
62 -
 63
63 -
 64
64 -
 65
65 -
 66
66 -
 67
67 -
 68
68 -
 69
69 -
 70
70 -
 71
71 -
 72
72 -
 73
73 -
 74
74 -
 75
75 -
 76
76 -
 77
77 -
 78
78 -
 79
79 -
 80
80 -
 81
81 -
82
-
83
-
84
-
85
-
86
-
87
-
88
-
89
-
90
-
91
-
92
-
93
-
94
-
95
-
96
-
97
-
98
-
99
-
100
-
101
-
102
-
103
-
104
-
105
-
106
-
107
-
108
-
109
-
110
-
111
-
112
-
113
-
114
-
115
-
116
-
117
-
118
-
119
-
120
-
121
-
122
-
123
-
124
-
125
-
126
-
127
-
128
-
129
-
130
-
131
-
132
-
133
-
134
-
135
-
136
 |
 |

A-13
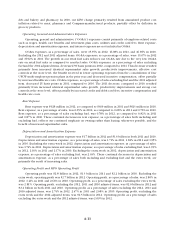
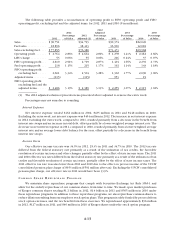
The following table provides a reconciliation of operating profit to FIFO operating profit and FIFO
operating profit, excluding fuel and the adjusted items, for 2012, 2011 and 2010 ($ in millions):
2012
2012
Percentage
of Sales
2012
Adjusted (1)
2012
Adjusted
Percentage
of Sales 2011
2011
Percentage
of Sales 2010
2010
Percentage
of Sales
Sales ................ $ 96,751 $94,793 $90,374 $82,049
Fuel sales ............ 18,896 18,413 16,901 12,081
Sales excluding fuel .... $ 77,855 $76,380 $73,473 $69,968
Operating profit....... $ 2,764 2.86% $ 2,664 2.81% $ 1,278 1.41% $ 2,182 2.66%
LIFO charge .......... 55 0.06% 55 0.06% 216 0.24% 57 0.07%
FIFO operating profit... 2,819 2.91% 2,719 2.87% 1,494 1.65% 2,239 2.73%
Fuel operating profit ... 218 1.15% 215 1.17% 192 1.14% 143 1.18%
FIFO operating profit
excluding fuel...... 2,601 3.34% 2,504 3.28% 1,302 1.77% 2,096 3.00%
Adjusted items ........ (115) (115) 953 19
FIFO operating profit
excluding fuel and the
adjusted items...... $ 2,486 3.19% $ 2,389 3.13% $ 2,255 3.07% $ 2,115 3.02%
(1) The 2012 adjusted column represents items presented above adjusted to remove the extra week.
Percentages may not sum due to rounding.
Interest Expense
Net interest expense totaled $462 million in 2012, $435 million in 2011 and $448 million in 2010.
Excluding the extra week, net interest expense was $454 million in 2012. The increase in net interest expense
in 2012 excluding the extra week, compared to 2011, resulted primarily from a decrease in the benefit from
interest rate swaps and an increase in total debt, offset partially by a lower weighted average interest rate. The
decrease in net interest expense in 2011, compared to 2010, resulted primarily from a lower weighted average
interest rate and an average lower debt balance for the year, offset partially by a decrease in the benefit from
interest rate swaps.
Income Taxes
Our effective income tax rate was 34.5% in 2012, 29.3% in 2011 and 34.7% in 2010. The 2012 tax rate
differed from the federal statutory rate primarily as a result of the utilization of tax credits, the favorable
resolution of certain tax issues and other changes, partially offset by the effect of state income taxes. The 2011
and 2010 effective tax rates differed from the federal statutory rate primarily as a result of the utilization of tax
credits and favorable resolution of certain tax issues, partially offset by the effect of state income taxes. The
2011 effective tax rate was also lower than 2012 and 2010 due to the effect on pre-tax income of the UFCW
consolidated pension plan charge of $953 million ($591 million after-tax). Excluding the UFCW consolidated
pension plan charge, our effective rate in 2011 would have been 33.9%.
CO M M O N S H A R E R E P U R C H A S E P R O G R A M
We maintain share repurchase programs that comply with Securities Exchange Act Rule 10b5-1 and
allow for the orderly repurchase of our common shares, from time to time. We made open market purchases
of Kroger common shares totaling $1.2 billion in 2012, $1.4 billion in 2011 and $505 million in 2010 under
these repurchase programs. In addition to these repurchase programs, we also repurchase common shares to
reduce dilution resulting from our employee stock option plans. This program is solely funded by proceeds from
stock option exercises, and the tax benefit from these exercises. We repurchased approximately $96 million
in 2012, $127 million in 2011, and $40 million in 2010 of Kroger shares under the stock option program.