Kroger 2012 Annual Report Download - page 74
Download and view the complete annual report
Please find page 74 of the 2012 Kroger annual report below. You can navigate through the pages in the report by either clicking on the pages listed below, or by using the keyword search tool below to find specific information within the annual report.-
 1
1 -
2
-
3
-
4
-
5
-
6
-
7
-
8
-
9
-
10
-
11
-
12
-
13
-
14
-
15
-
16
-
17
-
18
-
19
-
20
-
21
-
22
-
23
-
24
-
25
-
26
-
27
-
28
-
29
-
30
-
31
-
32
-
33
-
34
-
35
-
36
-
37
-
38
-
39
-
40
-
41
-
42
-
43
-
44
-
45
-
46
-
47
-
48
-
49
-
50
-
51
-
52
-
53
-
54
-
55
-
56
-
57
-
58
-
59
-
60
-
61
-
62
-
63
-
 64
64 -
 65
65 -
 66
66 -
 67
67 -
 68
68 -
 69
69 -
 70
70 -
 71
71 -
 72
72 -
 73
73 -
 74
74 -
 75
75 -
 76
76 -
 77
77 -
 78
78 -
 79
79 -
 80
80 -
 81
81 -
 82
82 -
 83
83 -
 84
84 -
85
-
86
-
87
-
88
-
89
-
90
-
91
-
92
-
93
-
94
-
95
-
96
-
97
-
98
-
99
-
100
-
101
-
102
-
103
-
104
-
105
-
106
-
107
-
108
-
109
-
110
-
111
-
112
-
113
-
114
-
115
-
116
-
117
-
118
-
119
-
120
-
121
-
122
-
123
-
124
-
125
-
126
-
127
-
128
-
129
-
130
-
131
-
132
-
133
-
134
-
135
-
136
 |
 |
A-16
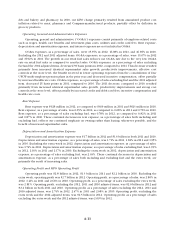
Self-Insurance Costs
We primarily are self-insured for costs related to workers’ compensation and general liability claims.
The liabilities represent our best estimate, using generally accepted actuarial reserving methods, of the
ultimate obligations for reported claims plus those incurred but not reported for all claims incurred through
February 2, 2013. We establish case reserves for reported claims using case-basis evaluation of the underlying
claim data and we update as information becomes known.
For both workers’ compensation and general liability claims, we have purchased stop-loss coverage to
limit our exposure to any significant exposure on a per claim basis. We are insured for covered costs in excess
of these per claim limits. We account for the liabilities for workers’ compensation claims on a present value
basis utilizing a risk-adjusted discount rate. A 25 basis point decrease in our discount rate would increase our
liability by approximately $2 million. General liability claims are not discounted.
The assumptions underlying the ultimate costs of existing claim losses are subject to a high degree of
unpredictability, which can affect the liability recorded for such claims. For example, variability in inflation
rates of health care costs inherent in these claims can affect the amounts realized. Similarly, changes in legal
trends and interpretations, as well as a change in the nature and method of how claims are settled can affect
ultimate costs. Our estimates of liabilities incurred do not anticipate significant changes in historical trends
for these variables, and any changes could have a considerable effect on future claim costs and currently
recorded liabilities.
Impairments of Long-Lived Assets
We monitor the carrying value of long-lived assets for potential impairment each quarter based on
whether certain trigger events have occurred. These events include current period losses combined with a
history of losses or a projection of continuing losses or a significant decrease in the market value of an asset.
When a trigger event occurs, we perform an impairment calculation, comparing projected undiscounted
cash flows, utilizing current cash flow information and expected growth rates related to specific stores,
to the carrying value for those stores. If we identify impairment for long-lived assets to be held and used,
we compare the assets’ current carrying value to the assets’ fair value. Fair value is determined based on
market values or discounted future cash flows. We record impairment when the carrying value exceeds fair
market value. With respect to owned property and equipment held for disposal, we adjust the value of the
property and equipment to reflect recoverable values based on our previous efforts to dispose of similar assets
and current economic conditions. We recognize impairment for the excess of the carrying value over the
estimated fair market value, reduced by estimated direct costs of disposal. We recorded asset impairments in
the normal course of business totaling $18 million in 2012, $37 million in 2011 and $25 million in 2010. We
record costs to reduce the carrying value of long-lived assets in the Consolidated Statements of Operations as
“Operating, general and administrative” expense.
The factors that most significantly affect the impairment calculation are our estimates of future cash
flows. Our cash flow projections look several years into the future and include assumptions on variables such
as inflation, the economy and market competition. Application of alternative assumptions and definitions, such
as reviewing long-lived assets for impairment at a different level, could produce significantly different results.
Goodwill
Our goodwill totaled $1.2 billion as of February 2, 2013. We review goodwill for impairment in the
fourth quarter of each year, and also upon the occurrence of triggering events. We perform reviews of each of
our operating divisions and variable interest entities (collectively, our reporting units) with goodwill balances.
Fair value is determined using a multiple of earnings, or discounted projected future cash flows, and we
compare fair value to the carrying value of a reporting unit for purposes of identifying potential impairment.
We base projected future cash flows on management’s knowledge of the current operating environment and
expectations for the future. If we identify potential for impairment, we measure the fair value of a reporting
unit against the fair value of its underlying assets and liabilities, excluding goodwill, to estimate an implied
fair value of the division’s goodwill. We recognize goodwill impairment for any excess of the carrying value
of the division’s goodwill over the implied fair value.