Kroger 2012 Annual Report Download - page 123
Download and view the complete annual report
Please find page 123 of the 2012 Kroger annual report below. You can navigate through the pages in the report by either clicking on the pages listed below, or by using the keyword search tool below to find specific information within the annual report.-
 1
1 -
2
-
3
-
4
-
5
-
6
-
7
-
8
-
9
-
10
-
11
-
12
-
13
-
14
-
15
-
16
-
17
-
18
-
19
-
20
-
21
-
22
-
23
-
24
-
25
-
26
-
27
-
28
-
29
-
30
-
31
-
32
-
33
-
34
-
35
-
36
-
37
-
38
-
39
-
40
-
41
-
42
-
43
-
44
-
45
-
46
-
47
-
48
-
49
-
50
-
51
-
52
-
53
-
54
-
55
-
56
-
57
-
58
-
59
-
60
-
61
-
62
-
63
-
64
-
65
-
66
-
67
-
68
-
69
-
70
-
71
-
72
-
73
-
74
-
75
-
76
-
77
-
78
-
79
-
80
-
81
-
82
-
83
-
84
-
85
-
86
-
87
-
88
-
89
-
90
-
91
-
92
-
93
-
94
-
95
-
96
-
97
-
98
-
99
-
100
-
101
-
102
-
103
-
104
-
105
-
106
-
107
-
108
-
109
-
110
-
111
-
112
-
 113
113 -
 114
114 -
 115
115 -
 116
116 -
 117
117 -
 118
118 -
 119
119 -
 120
120 -
 121
121 -
 122
122 -
 123
123 -
 124
124 -
 125
125 -
 126
126 -
 127
127 -
 128
128 -
 129
129 -
 130
130 -
 131
131 -
 132
132 -
 133
133 -
134
-
135
-
136
 |
 |

A-65
NO T E S T O C O N S O L I D A T E D F I N A N C I A L S T A T E M E N T S , CO N T I N U E D
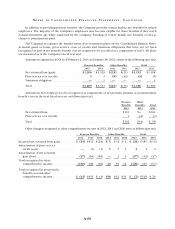
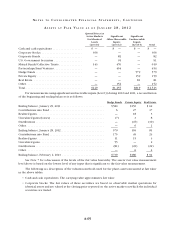
AS S E T S A T F A I R VA L U E A S O F J A N U A R Y 2 8 , 2 0 1 2
Quoted Prices in
Active Markets
for Identical
Assets
(Level 1)
Significant
Other Observable
Inputs
(Level 2)
Significant
Unobservable
Inputs
(Level 3) Total
Cash and cash equivalents ................... $ — $ — $ — $ —
Corporate Stocks ........................... 306 — — 306
Corporate Bonds ........................... — 82 — 82
U.S. Government Securities .................. — 91 — 91
Mutual Funds/Collective Trusts ............... 143 476 — 619
Partnerships/Joint Ventures .................. — 454 — 454
Hedge Funds .............................. — — 579 579
Private Equity ............................. — — 159 159
Real Estate ................................ — — 81 81
Other .................................... — 152 — 152
Total. . . . . . . . . . . . . . . . . . . . . . . . . . . . . . . . . . . . . $449 $1,255 $819 $ 2,523
For measurements using significant unobservable inputs (Level 3) during 2012 and 2011, a reconciliation
of the beginning and ending balances is as follows:
Hedge Funds Private Equity Real Estate
Ending balance, January 29, 2011 ............................ $580 $150 $ 62
Contributions into Fund ................................... 6 27 17
Realized gains ........................................... — 18 3
Unrealized gains (losses) .................................. (7) 3 8
Distributions ............................................ — (45) (10)
Other .................................................. — 6 1
Ending balance, January 28, 2012 ............................ 579 159 81
Contributions into Fund ................................... 175 49 23
Realized gains ........................................... 11 15 3
Unrealized gains ......................................... 55 — 2
Distributions ............................................ (81) (49) (22)
Other .................................................. — 6 4
Ending balance, February 2, 2013 ........................... $739 $180 $ 91
See Note 7 for a discussion of the levels of the fair value hierarchy. The assets’ fair value measurement
level above is based on the lowest level of any input that is significant to the fair value measurement.
The following is a description of the valuation methods used for the plan’s assets measured at fair value
in the above tables:
• Cashandcashequivalents:Thecarryingvalueapproximatesfairvalue.
• Corporate Stocks: The fair values of these securities are based on observable market quotations for
identical assets and are valued at the closing price reported on the active market on which the individual
securities are traded.