Kroger 2012 Annual Report Download - page 76
Download and view the complete annual report
Please find page 76 of the 2012 Kroger annual report below. You can navigate through the pages in the report by either clicking on the pages listed below, or by using the keyword search tool below to find specific information within the annual report.-
 1
1 -
2
-
3
-
4
-
5
-
6
-
7
-
8
-
9
-
10
-
11
-
12
-
13
-
14
-
15
-
16
-
17
-
18
-
19
-
20
-
21
-
22
-
23
-
24
-
25
-
26
-
27
-
28
-
29
-
30
-
31
-
32
-
33
-
34
-
35
-
36
-
37
-
38
-
39
-
40
-
41
-
42
-
43
-
44
-
45
-
46
-
47
-
48
-
49
-
50
-
51
-
52
-
53
-
54
-
55
-
56
-
57
-
58
-
59
-
60
-
61
-
62
-
63
-
64
-
65
-
 66
66 -
 67
67 -
 68
68 -
 69
69 -
 70
70 -
 71
71 -
 72
72 -
 73
73 -
 74
74 -
 75
75 -
 76
76 -
 77
77 -
 78
78 -
 79
79 -
 80
80 -
 81
81 -
 82
82 -
 83
83 -
 84
84 -
 85
85 -
 86
86 -
87
-
88
-
89
-
90
-
91
-
92
-
93
-
94
-
95
-
96
-
97
-
98
-
99
-
100
-
101
-
102
-
103
-
104
-
105
-
106
-
107
-
108
-
109
-
110
-
111
-
112
-
113
-
114
-
115
-
116
-
117
-
118
-
119
-
120
-
121
-
122
-
123
-
124
-
125
-
126
-
127
-
128
-
129
-
130
-
131
-
132
-
133
-
134
-
135
-
136
 |
 |

A-18
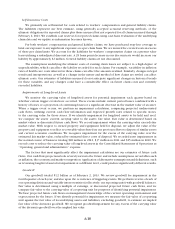
among others, the discount rate, the expected long-term rate of return on plan assets, average life expectancy
and the rate of increases in compensation and health care costs. Actual results that differ from our assumptions
are accumulated and amortized over future periods and, therefore, generally affect our recognized expense
and recorded obligation in future periods. While we believe that our assumptions are appropriate, significant
differences in our actual experience or significant changes in our assumptions, including the discount rate
used and the expected return on plan assets, may materially affect our pension and other post-retirement
obligations and our future expense. Note 13 to the Consolidated Financial Statements discusses the effect
of a 1% change in the assumed health care cost trend rate on other post-retirement benefit costs and the
related liability.
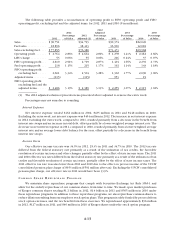
The objective of our discount rate assumptions was intended to reflect the rates at which the pension
benefits could be effectively settled. In making this determination, we take into account the timing and
amount of benefits that would be available under the plans. Our policy for selecting the discount rates as of
year-end 2012 changed from the policy as of year-end 2011 and 2010. In 2012, our policy was to match the
plan’s cash flows to that of a hypothetical bond portfolio whose cash flow from coupons and maturities match
the plan’s projected benefit cash flows. The discount rates are the single rates that produce the same present
value of cash flows. The selection of the 4.29% and 4.11% discount rates as of year-end 2012 for pension and
other benefits, respectively, represents the hypothetical bond portfolio using bonds with an AA or better
rating constructed with the assistance of an outside consultant. In 2011 and 2010, our policy was to match the
plan’s cash flows to that of a yield curve that provides the equivalent yields on zero-coupon corporate bonds
for each maturity. Benefit cash flows due in a particular year can theoretically be “settled” by “investing” them
in the zero-coupon bond that matures in the same year. The discount rates are the single rates that produce
the same present value of cash flows. The selection of the 4.55% and 4.40% discount rates as of year-end
2011 for pension and other benefits, respectively, represents the equivalent single rates constructed under
a broad-market AA yield curve constructed with the assistance of an outside consultant. A 100 basis point
increase in the discount rate would decrease the projected pension benefit obligation as of February 2, 2013,
by approximately $412.
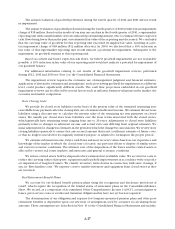
To determine the expected rate of return on pension plan assets, we consider current and forecasted
plan asset allocations as well as historical and forecasted rates of return on various asset categories. For 2012
and 2011, we assumed a pension plan investment return rate of 8.5%. Our pension plan’s average rate of
return was 9.7% for the 10 calendar years ended December 31, 2012, net of all investment management fees
and expenses. The value of all investments in our Company-sponsored defined benefit pension plans during
the calendar year ending December 31, 2012, net of investment management fees and expenses, increased
15.0%. For the past 20 years, our average annual rate of return has been 9.9%. The average annual return for
the S&P 500 over the same period of time has been 8.5%. Based on the above information and forward looking
assumptions for investments made in a manner consistent with our target allocations, we believe an 8.5% rate
of return assumption is reasonable. See Note 13 to the Consolidated Financial Statements for more information
on the asset allocations of pension plan assets.
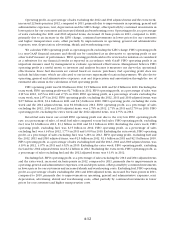
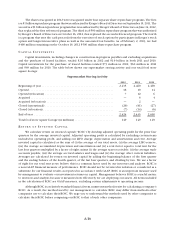
Sensitivity to changes in the major assumptions used in the calculation of Kroger’s pension plan liabilities
for the qualified plans is illustrated below (in millions).
Percentage
Point Change
Projected Benefit
Obligation
Decrease/(Increase)
Expense
Decrease/(Increase)
Discount Rate.............................. +/- 1.0% $412/(502) $32/($36)
Expected Return on Assets ................... +/- 1.0% — $26/($26)
We contributed $71 million in 2012, $52 million in 2011 and $141 million in 2010 to our Company-
sponsored defined benefit pension plans. In February 2013, we contributed $100 million to the Company-
sponsored defined benefit pension plans and do not expect to make any additional contributions in 2013. We
expect contributions made during 2013 will decrease our required contributions in future years. Among other
things, investment performance of plan assets, the interest rates required to be used to calculate the pension
obligations, and future changes in legislation, will determine the amounts of contributions.