Kraft 2004 Annual Report Download - page 84
Download and view the complete annual report
Please find page 84 of the 2004 Kraft annual report below. You can navigate through the pages in the report by either clicking on the pages listed below, or by using the keyword search tool below to find specific information within the annual report.-
 1
1 -
2
-
3
-
4
-
5
-
6
-
7
-
8
-
9
-
10
-
11
-
12
-
13
-
14
-
15
-
16
-
17
-
18
-
19
-
20
-
21
-
22
-
23
-
24
-
25
-
26
-
27
-
28
-
29
-
30
-
31
-
32
-
33
-
34
-
35
-
36
-
37
-
38
-
39
-
40
-
41
-
42
-
43
-
44
-
45
-
46
-
47
-
48
-
49
-
50
-
51
-
52
-
53
-
54
-
55
-
56
-
57
-
58
-
59
-
60
-
61
-
62
-
63
-
64
-
65
-
66
-
67
-
68
-
69
-
70
-
71
-
72
-
73
-
 74
74 -
 75
75 -
 76
76 -
 77
77 -
 78
78 -
 79
79 -
 80
80 -
 81
81 -
 82
82 -
 83
83 -
 84
84 -
 85
85 -
 86
86 -
 87
87 -
 88
88 -
 89
89 -
 90
90 -
 91
91 -
 92
92 -
 93
93 -
 94
94 -
95
 |
 |

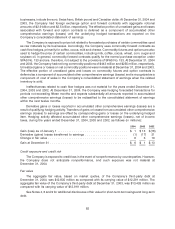
Note 18. Contingencies:
Kraft and its subsidiaries are parties to a variety of legal proceedings arising out of the normal
course of business, including a few cases in which substantial amounts of damages are sought. While
the results of litigation cannot be predicted with certainty, management believes that the final outcome of
these proceedings will not have a material adverse effect on the Company’s consolidated financial
position, results of operations or cash flows.
Third-Party Guarantees
At December 31, 2004, the Company’s third-party guarantees, which are primarily derived from
acquisition and divestiture activities, approximated $25 million. Substantially all of these guarantees
expire through 2013, with $1 million expiring during 2005. The Company is required to perform under
these guarantees in the event that a third party fails to make contractual payments or achieve
performance measures. The Company has a liability of $20 million on its consolidated balance sheet at
December 31, 2004, relating to these guarantees.
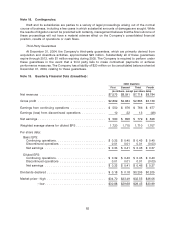
Note 19. Quarterly Financial Data (Unaudited):
2004 Quarters
First Second Third Fourth
(in millions, except per share data)
Net revenues .................................... $7,575 $8,091 $7,718 $8,784
Gross profit ..................................... $2,899 $2,984 $2,865 $3,139
Earnings from continuing operations ................... $ 550 $ 676 $ 766 $ 677
Earnings (loss) from discontinued operations ............. 10 22 13 (49)
Net earnings ..................................... $ 560 $ 698 $ 779 $ 628
Weighted average shares for diluted EPS ................ 1,720 1,715 1,710 1,707
Per share data:
Basic EPS:
Continuing operations ........................... $ 0.32 $ 0.40 $ 0.45 $ 0.40
Discontinued operations ......................... 0.01 0.01 0.01 (0.03)
Net earnings ................................. $ 0.33 $ 0.41 $ 0.46 $ 0.37
Diluted EPS:
Continuing operations ........................... $ 0.32 $ 0.40 $ 0.45 $ 0.40
Discontinued operations ......................... 0.01 0.01 0.01 (0.03)
Net earnings ................................. $ 0.33 $ 0.41 $ 0.46 $ 0.37
Dividends declared ................................ $ 0.18 $ 0.18 $0.205 $0.205
Market price—high ................................ $34.70 $33.49 $32.55 $36.06
—low................................. $30.88 $29.68 $29.45 $30.99
83