Kraft 2004 Annual Report Download - page 34
Download and view the complete annual report
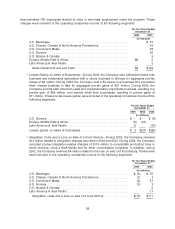
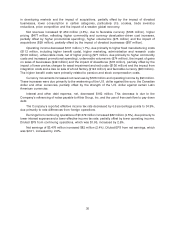
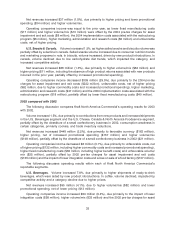
Please find page 34 of the 2004 Kraft annual report below. You can navigate through the pages in the report by either clicking on the pages listed below, or by using the keyword search tool below to find specific information within the annual report.Net revenues increased $37 million (1.5%), due primarily to higher pricing and lower promotional
spending ($34 million) and higher volume/mix.
Operating companies income was equal to the prior year, as lower fixed manufacturing costs
($17 million) and higher volume/mix ($10 million) were offset by the 2004 pre-tax charges for asset
impairment and exit costs ($8 million), the 2004 implementation costs associated with the restructuring
program ($6 million), higher marketing, administration and research costs ($5 million) and unfavorable
costs, net of higher pricing.
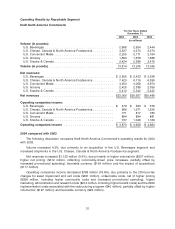
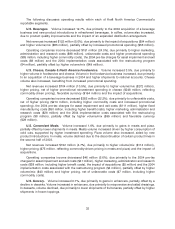
U.S. Snacks & Cereals. Volume increased 1.5%, as higher salted snacks and biscuits volume was
partially offset by a decline in cereals. Salted snacks volume increased due to consumer nutrition trends
and marketing programs in nuts. In biscuits, volume increased, driven by new product introductions. In
cereals, volume declined due to low carbohydrate diet trends, which impacted the category, and
increased competitive activity.
Net revenues increased $68 million (1.3%), due primarily to higher volume/mix ($62 million) and
higher pricing ($11 million, including the absence of high product returns associated with new products
incurred in the prior year, partially offset by increased promotional spending).
Operating companies income decreased $309 million (29.5%), due primarily to the 2004 pre-tax
charges for asset impairment and exit costs ($222 million), unfavorable costs, net of higher pricing
($62 million, due to higher commodity costs and increased promotional spending), higher marketing,
administration and research costs ($47 million) and the 2004 implementation costs associated with the
restructuring program ($18 million), partially offset by lower fixed manufacturing costs ($40 million).
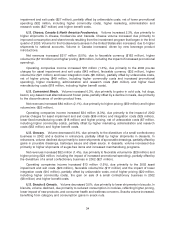
2003 compared with 2002
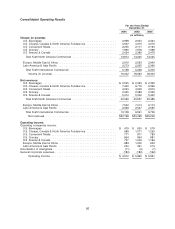
The following discussion compares Kraft North America Commercial’s operating results for 2003
with 2002.
Volume increased 1.5%, due primarily to contributions from new products and increased shipments
in the U.S. Beverages segment and the U.S. Cheese, Canada & North America Foodservice segment,
partially offset by the divestiture of a small confectionery business in 2002, consumption weakness in
certain categories, primarily cookies, and trade inventory reductions.
Net revenues increased $448 million (2.2%), due primarily to favorable currency ($162 million),
higher pricing, net of increased promotional spending ($157 million) and higher volume/mix
($148 million), partially offset by the divestiture of a small confectionery business in 2002 ($21 million).
Operating companies income decreased $6 million (0.1%), due primarily to unfavorable costs, net
of higher pricing ($132 million, including higher commodity costs and increased promotional spending),
higher fixed manufacturing costs ($82 million, including higher benefit costs) and unfavorable volume/
mix ($35 million), partially offset by 2002 pre-tax charges for asset impairment and exit costs
($135 million) and the impact of lower integration costs and a loss on sale of a food factory ($107 million).
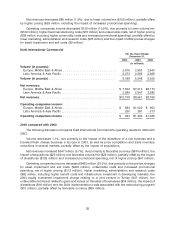
The following discusses operating results within each of Kraft North America Commercial’s
reportable segments.
U.S. Beverages. Volume increased 7.8%, due primarily to higher shipments of ready-to-drink
beverages, which were aided by new product introductions. In coffee, volume declined, impacted by
competitive activity and a category decline due to higher prices.
Net revenues increased $95 million (4.1%), due to higher volume/mix ($82 million) and lower
promotional spending, net of lower pricing ($13 million).
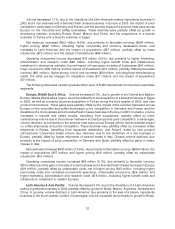
Operating companies income increased $54 million (9.4%), due primarily to the impact of lower
integration costs ($58 million), higher volume/mix ($33 million) and the 2002 pre-tax charges for asset
33


