Kraft 2004 Annual Report Download - page 33
Download and view the complete annual report
Please find page 33 of the 2004 Kraft annual report below. You can navigate through the pages in the report by either clicking on the pages listed below, or by using the keyword search tool below to find specific information within the annual report.-
 1
1 -
2
-
3
-
4
-
5
-
6
-
7
-
8
-
9
-
10
-
11
-
12
-
13
-
14
-
15
-
16
-
17
-
18
-
19
-
20
-
21
-
22
-
 23
23 -
 24
24 -
 25
25 -
 26
26 -
 27
27 -
 28
28 -
 29
29 -
 30
30 -
 31
31 -
 32
32 -
 33
33 -
 34
34 -
 35
35 -
 36
36 -
 37
37 -
 38
38 -
 39
39 -
 40
40 -
 41
41 -
 42
42 -
 43
43 -
44
-
45
-
46
-
47
-
48
-
49
-
50
-
51
-
52
-
53
-
54
-
55
-
56
-
57
-
58
-
59
-
60
-
61
-
62
-
63
-
64
-
65
-
66
-
67
-
68
-
69
-
70
-
71
-
72
-
73
-
74
-
75
-
76
-
77
-
78
-
79
-
80
-
81
-
82
-
83
-
84
-
85
-
86
-
87
-
88
-
89
-
90
-
91
-
92
-
93
-
94
-
95
 |
 |
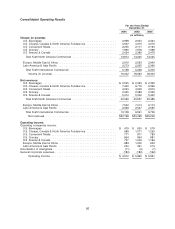
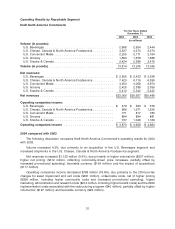
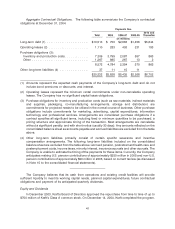
The following discusses operating results within each of Kraft North America Commercial’s
reportable segments.
U.S. Beverages. Volume increased 12.7%, due primarily to the 2004 acquisition of a beverage
business and new product introductions in refreshment beverages. In coffee, volume also increased,
due to product quality improvements and the impact of an expanded distribution arrangement.
Net revenues increased $122 million (5.0%), due primarily to the impact of acquisitions ($94 million)
and higher volume/mix ($85 million), partially offset by increased promotional spending ($56 million).
Operating companies income decreased $151 million (24.0%), due primarily to higher marketing,
administration and research costs ($98 million), unfavorable costs and higher promotional spending
($85 million, including higher commodity costs), the 2004 pre-tax charges for asset impairment and exit
costs ($9 million) and the 2004 implementation costs associated with the restructuring program
($4 million), partially offset by higher volume/mix ($49 million).
U.S. Cheese, Canada & North America Foodservice. Volume increased 3.5%, due primarily to
higher volume in foodservice and cheese. Volume in the foodservice business increased, due primarily
to an acquisition of a beverage business in 2004 and higher shipments to national accounts. Cheese
volume also increased, benefiting from increased promotional spending.
Net revenues increased $704 million (10.5%), due primarily to higher volume/mix ($272 million),
higher pricing, net of higher promotional reinvestment spending in cheese ($248 million, reflecting
commodity-driven pricing), favorable currency ($164 million) and the impact of acquisitions.
Operating companies income decreased $282 million (22.2%), due primarily to unfavorable costs,
net of higher pricing ($214 million, including higher commodity costs and increased promotional
spending), the 2004 pre-tax charges for asset impairment and exit costs ($111 million), higher fixed
manufacturing costs ($50 million, including higher benefit costs), higher marketing, administration and
research costs ($26 million) and the 2004 implementation costs associated with the restructuring
program ($8 million), partially offset by higher volume/mix ($99 million) and favorable currency
($29 million).
U.S. Convenient Meals. Volume increased 1.6%, due primarily to gains in meats and pizza,
partially offset by lower shipments in meals. Meats volume increased driven by higher consumption of
cold cuts, supported by higher investment spending. Pizza volume also increased, aided by new
product introductions. In meals, volume declined due to the discontinuation of certain product lines in
the second half of 2003.
Net revenues increased $192 million (4.7%), due primarily to higher volume/mix ($114 million),
higher pricing ($75 million, reflecting commodity-driven pricing in meats and pizza) and the impact of
acquisitions.
Operating companies income decreased $46 million (5.6%), due primarily to the 2004 pre-tax
charges for asset impairment and exit costs ($41 million), higher marketing, administration and research
costs ($38 million, including higher benefit costs), the impact of acquisitions ($5 million) and the 2004
implementation costs associated with the restructuring program ($4 million), partially offset by higher
volume/mix ($40 million) and higher pricing, net of unfavorable costs ($7 million, including higher
commodity costs).
U.S. Grocery. Volume increased 0.7%, due primarily to gains in enhancers, partially offset by a
decline in desserts. Volume increased in enhancers, due primarily to mayonnaise and salad dressings.
In desserts, volume declined, due primarily to lower shipments of fruit snacks, partially offset by higher
shipments in frozen toppings.
32