Kraft 2004 Annual Report Download - page 74
Download and view the complete annual report
Please find page 74 of the 2004 Kraft annual report below. You can navigate through the pages in the report by either clicking on the pages listed below, or by using the keyword search tool below to find specific information within the annual report.-
 1
1 -
2
-
3
-
4
-
5
-
6
-
7
-
8
-
9
-
10
-
11
-
12
-
13
-
14
-
15
-
16
-
17
-
18
-
19
-
20
-
21
-
22
-
23
-
24
-
25
-
26
-
27
-
28
-
29
-
30
-
31
-
32
-
33
-
34
-
35
-
36
-
37
-
38
-
39
-
40
-
41
-
42
-
43
-
44
-
45
-
46
-
47
-
48
-
49
-
50
-
51
-
52
-
53
-
54
-
55
-
56
-
57
-
58
-
59
-
60
-
61
-
62
-
63
-
 64
64 -
 65
65 -
 66
66 -
 67
67 -
 68
68 -
 69
69 -
 70
70 -
 71
71 -
 72
72 -
 73
73 -
 74
74 -
 75
75 -
 76
76 -
 77
77 -
 78
78 -
 79
79 -
 80
80 -
 81
81 -
 82
82 -
 83
83 -
 84
84 -
85
-
86
-
87
-
88
-
89
-
90
-
91
-
92
-
93
-
94
-
95
 |
 |

For the Years Ended
December 31,
2004 2003 2002
(in millions)
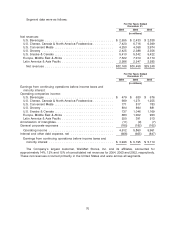
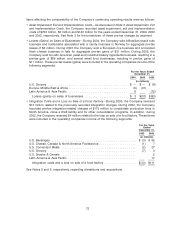
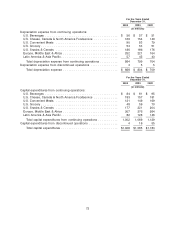
Depreciation expense from continuing operations:
U.S. Beverages ........................................ $ 56 $ 57 $ 51
U.S. Cheese, Canada & North America Foodservice ............. 169 154 140
U.S. Convenient Meals .................................. 90 83 79
U.S. Grocery .......................................... 54 53 51
U.S. Snacks & Cereals .................................. 186 186 176
Europe, Middle East & Africa .............................. 252 221 164
Latin America & Asia Pacific ............................... 57 45 43
Total depreciation expense from continuing operations .......... 864 799 704
Depreciation expense from discontinued operations ............... 4 5 5
Total depreciation expense .............................. $ 868 $ 804 $ 709
For the Years Ended
December 31,
2004 2003 2002
(in millions)
Capital expenditures from continuing operations:
U.S. Beverages ........................................ $ 84 $ 81 $ 95
U.S. Cheese, Canada & North America Foodservice ............. 183 157 181
U.S. Convenient Meals .................................. 121 149 169
U.S. Grocery .......................................... 48 59 70
U.S. Snacks & Cereals .................................. 177 221 204
Europe, Middle East & Africa .............................. 307 276 264
Latin America & Asia Pacific ............................... 82 126 146
Total capital expenditures from continuing operations ........... 1,002 1,069 1,129
Capital expenditures from discontinued operations ................ 4 16 55
Total capital expenditures ............................... $1,006 $1,085 $1,184
73