Kraft 2004 Annual Report Download - page 16
Download and view the complete annual report
Please find page 16 of the 2004 Kraft annual report below. You can navigate through the pages in the report by either clicking on the pages listed below, or by using the keyword search tool below to find specific information within the annual report.-
 1
1 -
2
-
3
-
4
-
5
-
 6
6 -
 7
7 -
 8
8 -
 9
9 -
 10
10 -
 11
11 -
 12
12 -
 13
13 -
 14
14 -
 15
15 -
 16
16 -
 17
17 -
 18
18 -
 19
19 -
 20
20 -
 21
21 -
 22
22 -
 23
23 -
 24
24 -
 25
25 -
 26
26 -
27
-
28
-
29
-
30
-
31
-
32
-
33
-
34
-
35
-
36
-
37
-
38
-
39
-
40
-
41
-
42
-
43
-
44
-
45
-
46
-
47
-
48
-
49
-
50
-
51
-
52
-
53
-
54
-
55
-
56
-
57
-
58
-
59
-
60
-
61
-
62
-
63
-
64
-
65
-
66
-
67
-
68
-
69
-
70
-
71
-
72
-
73
-
74
-
75
-
76
-
77
-
78
-
79
-
80
-
81
-
82
-
83
-
84
-
85
-
86
-
87
-
88
-
89
-
90
-
91
-
92
-
93
-
94
-
95
 |
 |

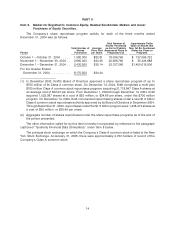
Item 6. Selected Financial Data.
KRAFT FOODS INC.
Selected Financial Data—Five Year Review (in millions of dollars, except per share data)
2004 2003 2002 2001 2000
Summary of Operations:
Net revenues ..................... $ 32,168 $ 30,498 $ 29,248 $ 28,731 $22,720
Cost of sales ..................... 20,281 18,531 17,463 17,310 13,872
Operating income .................. 4,612 5,860 5,961 4,717 3,933
Interest and other debt expense, net ...... 666 665 847 1,437 597
Earnings from continuing operations, before
income taxes and minority interest ...... 3,946 5,195 5,114 3,280 3,336
Pre-tax profit margin from continuing
operations ...................... 12.3% 17.0% 17.5% 11.4% 14.7%
Provision for income taxes ............ 1,274 1,812 1,813 1,484 1,380
Minority interest in earnings from continuing
operations, net ................... 3 4 4 — —
(Loss) earnings from discontinued
operations, net of income taxes ....... (4) 97 97 86 45
Net earnings ...................... 2,665 3,476 3,394 1,882 2,001
Basic EPS:
Continuing operations .............. 1.56 1.95 1.90 1.12 1.35
Discounted operations .............. — 0.06 0.06 0.05 0.03
Net earnings .................... 1.56 2.01 1.96 1.17 1.38
Diluted EPS:
Continuing operations .............. 1.55 1.95 1.90 1.12 1.35
Discontinued operations ............ — 0.06 0.06 0.05 0.03
Net earnings .................... 1.55 2.01 1.96 1.17 1.38
Dividends declared per share .......... 0.77 0.66 0.56 0.26 —
Weighted average shares (millions)—Basic . 1,709 1,727 1,734 1,610 1,455
Weighted average shares (millions)—Diluted 1,714 1,728 1,736 1,610 1,455
Capital expenditures ................ 1,006 1,085 1,184 1,101 906
Depreciation ...................... 868 804 709 680 499
Property, plant and equipment, net ....... 9,985 10,155 9,559 9,109 9,405
Inventories ....................... 3,447 3,343 3,382 3,026 3,041
Total assets ...................... 59,928 59,285 57,100 55,798 52,071
Long-term debt .................... 9,723 11,591 10,416 8,134 2,695
Notes payable to Altria Group, Inc. and
affiliates ....................... — — 2,560 5,000 21,407
Total debt ........................ 12,518 13,462 14,443 16,007 25,826
Total deferred income taxes ............ 5,101 5,175 4,917 4,565 942
Shareholders’ equity ................ 29,911 28,530 25,832 23,478 14,048
Common dividends declared as a % of
Basic EPS ...................... 49.4% 32.8% 28.6% 22.2% —
Common dividends declared as a % of
Diluted EPS ..................... 49.7% 32.8% 28.6% 22.2% —
Book value per common share outstanding . 17.54 16.57 14.92 13.53 9.65
Market price per Class A common share—
high/low ....................... 36.06-29.45 39.40-26.35 43.95-32.50 35.57-29.50 —
Closing price of Class A common share at
year end ....................... 35.61 32.22 38.93 34.03 —
Price/earnings ratio at year end—Basic .... 23 16 20 29 —
Price/earnings ratio at year end—Diluted . . . 23 16 20 29 —
Number of common shares outstanding at
year end (millions) ................ 1,705 1,722 1,731 1,735 1,455
Number of employees ............... 98,000 106,000 109,000 114,000 117,000
15