Kraft 2004 Annual Report Download - page 28
Download and view the complete annual report
Please find page 28 of the 2004 Kraft annual report below. You can navigate through the pages in the report by either clicking on the pages listed below, or by using the keyword search tool below to find specific information within the annual report.-
 1
1 -
2
-
3
-
4
-
5
-
6
-
7
-
8
-
9
-
10
-
11
-
12
-
13
-
14
-
15
-
16
-
17
-
 18
18 -
 19
19 -
 20
20 -
 21
21 -
 22
22 -
 23
23 -
 24
24 -
 25
25 -
 26
26 -
 27
27 -
 28
28 -
 29
29 -
 30
30 -
 31
31 -
 32
32 -
 33
33 -
 34
34 -
 35
35 -
 36
36 -
 37
37 -
 38
38 -
39
-
40
-
41
-
42
-
43
-
44
-
45
-
46
-
47
-
48
-
49
-
50
-
51
-
52
-
53
-
54
-
55
-
56
-
57
-
58
-
59
-
60
-
61
-
62
-
63
-
64
-
65
-
66
-
67
-
68
-
69
-
70
-
71
-
72
-
73
-
74
-
75
-
76
-
77
-
78
-
79
-
80
-
81
-
82
-
83
-
84
-
85
-
86
-
87
-
88
-
89
-
90
-
91
-
92
-
93
-
94
-
95
 |
 |

For the Years Ended
December 31,
2004 2003 2002
(in millions,
except per share data)
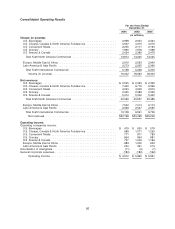
Net Earnings:
Earnings from continuing operations ............................. $ 2,669 $ 3,379 $ 3,297
(Loss) earnings from discontinued operations, net of income taxes ......... (4) 97 97
Net earnings ............................................. $ 2,665 $ 3,476 $ 3,394
Weighted average shares for diluted earnings per share .............. 1,714 1,728 1,736
Diluted earnings per share:
Continuing operations ..................................... $ 1.55 $ 1.95 $ 1.90
Discontinued operations .................................... 0.06 0.06
Net earnings ........................................... $ 1.55 $ 2.01 $ 1.96
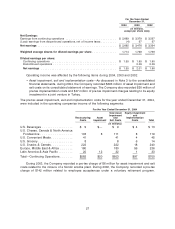
Operating income was affected by the following items during 2004, 2003 and 2002:
•Asset impairment, exit and implementation costs—As discussed in Note 3 to the consolidated
financial statements, during 2004, the Company recorded $603 million of asset impairment and
exit costs on its consolidated statement of earnings. The Company also recorded $50 million of
pre-tax implementation costs and $47 million of pre-tax impairment charges relating to its equity
investment in a joint venture in Turkey.
The pre-tax asset impairment, exit and implementation costs for the year ended December 31, 2004,
were included in the operating companies income of the following segments:
For the Year Ended December 31, 2004
Total Asset Equity Impairment
Impairment and
Restructuring Asset and Implementation
Costs Impairment Exit Costs Costs Total
(in millions)
U.S. Beverages ................. $ 9 $— $ 9 $ 4 $ 13
U.S. Cheese, Canada & North America
Foodservice .................. 103 8 111 8 119
U.S. Convenient Meals ............ 41 41 4 45
U.S. Grocery ................... 8 8 6 14
U.S. Snacks & Cereals ............ 222 222 18 240
Europe, Middle East & Africa ....... 180 180 56 236
Latin America & Asia Pacific ........ 20 12 32 1 33
Total—Continuing Operations ....... $583 $20 $603 $97 $700
During 2003, the Company recorded a pre-tax charge of $6 million for asset impairment and exit
costs related to the closure of a Nordic snacks plant. During 2002, the Company recorded a pre-tax
charge of $142 million related to employee acceptances under a voluntary retirement program.
27