Kraft 2004 Annual Report Download - page 31
Download and view the complete annual report
Please find page 31 of the 2004 Kraft annual report below. You can navigate through the pages in the report by either clicking on the pages listed below, or by using the keyword search tool below to find specific information within the annual report.-
 1
1 -
2
-
3
-
4
-
5
-
6
-
7
-
8
-
9
-
10
-
11
-
12
-
13
-
14
-
15
-
16
-
17
-
18
-
19
-
20
-
 21
21 -
 22
22 -
 23
23 -
 24
24 -
 25
25 -
 26
26 -
 27
27 -
 28
28 -
 29
29 -
 30
30 -
 31
31 -
 32
32 -
 33
33 -
 34
34 -
 35
35 -
 36
36 -
 37
37 -
 38
38 -
 39
39 -
 40
40 -
 41
41 -
42
-
43
-
44
-
45
-
46
-
47
-
48
-
49
-
50
-
51
-
52
-
53
-
54
-
55
-
56
-
57
-
58
-
59
-
60
-
61
-
62
-
63
-
64
-
65
-
66
-
67
-
68
-
69
-
70
-
71
-
72
-
73
-
74
-
75
-
76
-
77
-
78
-
79
-
80
-
81
-
82
-
83
-
84
-
85
-
86
-
87
-
88
-
89
-
90
-
91
-
92
-
93
-
94
-
95
 |
 |
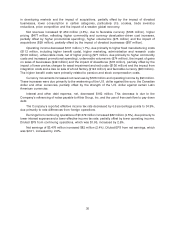
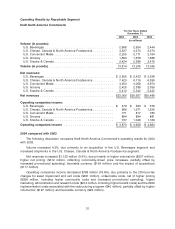
in developing markets and the impact of acquisitions, partially offset by the impact of divested
businesses, lower consumption in certain categories, particularly U.S. cookies, trade inventory
reductions, price competition and the impact of a weaker global economy.
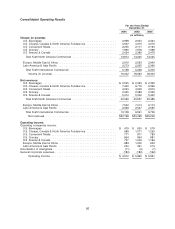
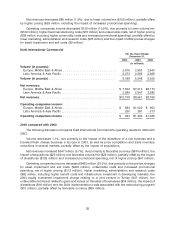
Net revenues increased $1,250 million (4.3%), due to favorable currency ($726 million), higher
pricing ($477 million, reflecting higher commodity and currency devaluation-driven cost increases,
partially offset by higher promotional spending), higher volume/mix ($75 million) and the impact of
acquisitions ($59 million), partially offset by the impact of divested businesses ($87 million).
Operating income decreased $101 million (1.7%), due primarily to higher fixed manufacturing costs
($113 million, including higher benefit costs), higher marketing, administration and research costs
($106 million), unfavorable costs, net of higher pricing ($77 million, due primarily to higher commodity
costs and increased promotional spending), unfavorable volume/mix ($74 million), the impact of gains
on sales of businesses ($49 million) and the impact of divestitures ($18 million), partially offset by the
impact of lower pre-tax charges for asset impairment and exit costs ($136 million) and the impact from
integration costs and a loss on sale of a food factory ($124 million) and favorable currency ($93 million).
The higher benefit costs were primarily related to pension and stock compensation costs.
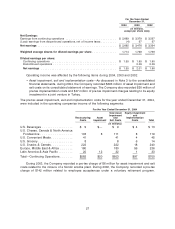
Currency movements increased net revenues by $726 million and operating income by $93 million.
These increases were due primarily to the weakening of the U.S. dollar against the euro, the Canadian
dollar and other currencies, partially offset by the strength of the U.S. dollar against certain Latin
American currencies.
Interest and other debt expense, net, decreased $182 million. This decrease is due to the
Company’s refinancing of notes payable to Altria Group, Inc. and the use of free cash flow to pay down
debt.
The Company’s reported effective income tax rate decreased by 0.6 percentage points to 34.9%,
due primarily to rate differences from foreign operations.
Earnings from continuing operations of $3,379 million increased $82 million (2.5%), due primarily to
lower interest expense and a lower effective income tax rate, partially offset by lower operating income.
Diluted EPS from continuing operations, which was $1.95, increased by 2.6%.
Net earnings of $3,476 million increased $82 million (2.4%). Diluted EPS from net earnings, which
was $2.01, increased by 2.6%.
30