Kraft 2004 Annual Report Download - page 54
Download and view the complete annual report
Please find page 54 of the 2004 Kraft annual report below. You can navigate through the pages in the report by either clicking on the pages listed below, or by using the keyword search tool below to find specific information within the annual report.-
 1
1 -
2
-
3
-
4
-
5
-
6
-
7
-
8
-
9
-
10
-
11
-
12
-
13
-
14
-
15
-
16
-
17
-
18
-
19
-
20
-
21
-
22
-
23
-
24
-
25
-
26
-
27
-
28
-
29
-
30
-
31
-
32
-
33
-
34
-
35
-
36
-
37
-
38
-
39
-
40
-
41
-
42
-
43
-
 44
44 -
 45
45 -
 46
46 -
 47
47 -
 48
48 -
 49
49 -
 50
50 -
 51
51 -
 52
52 -
 53
53 -
 54
54 -
 55
55 -
 56
56 -
 57
57 -
 58
58 -
 59
59 -
 60
60 -
 61
61 -
 62
62 -
 63
63 -
 64
64 -
65
-
66
-
67
-
68
-
69
-
70
-
71
-
72
-
73
-
74
-
75
-
76
-
77
-
78
-
79
-
80
-
81
-
82
-
83
-
84
-
85
-
86
-
87
-
88
-
89
-
90
-
91
-
92
-
93
-
94
-
95
 |
 |

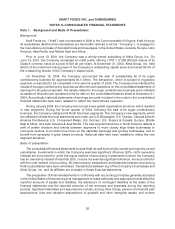
taxes. Actual results could differ from those estimates. The Company’s operating subsidiaries report
year-end results as of the Saturday closest to the end of each year.
Certain prior years’ amounts have been reclassified to conform with the current year’s presentation,
due primarily to the new segment structure and the classification of the sugar confectionery business as
discontinued operations.
Note 2. Summary of Significant Accounting Policies:
Cash and cash equivalents:
Cash equivalents include demand deposits with banks and all highly liquid investments with original
maturities of three months or less.
Depreciation, amortization and goodwill valuation:
Property, plant and equipment are stated at historical cost and depreciated by the straight-line
method over the estimated useful lives of the assets. Machinery and equipment are depreciated over
periods ranging from 3 to 20 years, and buildings and building improvements over periods up to
40 years.
Definite life intangible assets are amortized over their estimated useful lives. The Company is
required to conduct an annual review of goodwill and intangible assets for potential impairment.
Goodwill impairment testing requires a comparison between the carrying value and fair value of each
reporting unit. If the carrying value exceeds the fair value, goodwill is considered impaired. The amount
of impairment loss is measured as the difference between the carrying value and implied fair value of
goodwill, which is determined using discounted cash flows. Impairment testing for non-amortizable
intangible assets requires a comparison between fair value and carrying value of the intangible asset. If
the carrying value exceeds fair value, the intangible asset is considered impaired and is reduced to fair
value. During 2004, the Company completed its annual review of goodwill and intangible assets. This
review resulted in a $29 million non-cash pre-tax charge related to an intangible asset impairment for a
small confectionery business in the United States and certain brands in Mexico. A portion of this charge,
$12 million, was recorded as asset impairment and exit costs on the consolidated statement of earnings.
The remainder of the charge, $17 million, is included in discontinued operations.
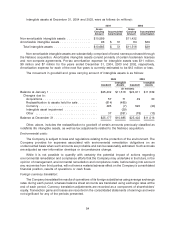
At December 31, 2004 and 2003, goodwill by reportable segment was as follows (in millions):
2004 2003
U.S. Beverages .............................................. $ 1,293 $ 1,236
U.S. Cheese, Canada & North America Foodservice .................... 5,382 5,401
U.S. Convenient Meals ......................................... 1,880 1,880
U.S. Grocery ................................................ 2,641 2,641
U.S. Snacks & Cereals ......................................... 8,658 9,395
Europe, Middle East & Africa ..................................... 5,014 4,562
Latin America & Asia Pacific ..................................... 309 287
Total goodwill .............................................. $25,177 $25,402
53