Kraft 2004 Annual Report Download - page 27
Download and view the complete annual report
Please find page 27 of the 2004 Kraft annual report below. You can navigate through the pages in the report by either clicking on the pages listed below, or by using the keyword search tool below to find specific information within the annual report.-
 1
1 -
2
-
3
-
4
-
5
-
6
-
7
-
8
-
9
-
10
-
11
-
12
-
13
-
14
-
15
-
16
-
 17
17 -
 18
18 -
 19
19 -
 20
20 -
 21
21 -
 22
22 -
 23
23 -
 24
24 -
 25
25 -
 26
26 -
 27
27 -
 28
28 -
 29
29 -
 30
30 -
 31
31 -
 32
32 -
 33
33 -
 34
34 -
 35
35 -
 36
36 -
 37
37 -
38
-
39
-
40
-
41
-
42
-
43
-
44
-
45
-
46
-
47
-
48
-
49
-
50
-
51
-
52
-
53
-
54
-
55
-
56
-
57
-
58
-
59
-
60
-
61
-
62
-
63
-
64
-
65
-
66
-
67
-
68
-
69
-
70
-
71
-
72
-
73
-
74
-
75
-
76
-
77
-
78
-
79
-
80
-
81
-
82
-
83
-
84
-
85
-
86
-
87
-
88
-
89
-
90
-
91
-
92
-
93
-
94
-
95
 |
 |

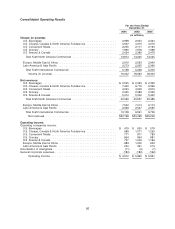
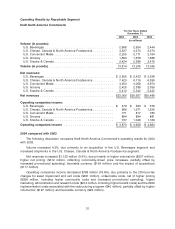
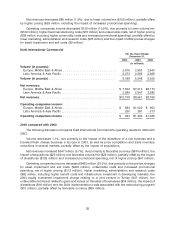
Consolidated Operating Results
For the Years Ended
December 31,
2004 2003 2002
(in millions)
Volume (in pounds):
U.S. Beverages .......................................... 2,968 2,634 2,444
U.S. Cheese, Canada & North America Foodservice ................. 4,527 4,373 4,273
U.S. Convenient Meals ..................................... 2,205 2,171 2,164
U.S. Grocery ............................................ 1,690 1,678 1,688
U.S. Snacks & Cereals ..................................... 2,424 2,389 2,476
Total Kraft North America Commercial ......................... 13,814 13,245 13,045
Europe, Middle East & Africa ................................. 2,915 2,953 2,943
Latin America & Asia Pacific ................................. 2,273 2,295 2,366
Total Kraft International Commercial ........................... 5,188 5,248 5,309
Volume (in pounds) .................................... 19,002 18,493 18,354
Net revenues:
U.S. Beverages .......................................... $ 2,555 $ 2,433 $ 2,338
U.S. Cheese, Canada & North America Foodservice ................. 7,420 6,716 6,399
U.S. Convenient Meals ..................................... 4,250 4,058 3,974
U.S. Grocery ............................................ 2,425 2,388 2,356
U.S. Snacks & Cereals ..................................... 5,410 5,342 5,422
Total Kraft North America Commercial ......................... 22,060 20,937 20,489
Europe, Middle East & Africa ................................. 7,522 7,014 6,174
Latin America & Asia Pacific ................................. 2,586 2,547 2,585
Total Kraft International Commercial ........................... 10,108 9,561 8,759
Net revenues ........................................ $32,168 $30,498 $29,248
Operating income:
Operating companies income:
U.S. Beverages .......................................... $ 479 $ 630 $ 576
U.S. Cheese, Canada & North America Foodservice ................. 989 1,271 1,255
U.S. Convenient Meals ..................................... 771 817 783
U.S. Grocery ............................................ 894 894 881
U.S. Snacks & Cereals ..................................... 737 1,046 1,169
Europe, Middle East & Africa ................................. 683 1,002 953
Latin America & Asia Pacific ................................. 250 391 513
Amortization of intangibles .................................... (11) (9) (7)
General corporate expenses ................................... (180) (182) (162)
Operating income ..................................... $ 4,612 $ 5,860 $ 5,961
26