Kraft 2004 Annual Report Download - page 32
Download and view the complete annual report
Please find page 32 of the 2004 Kraft annual report below. You can navigate through the pages in the report by either clicking on the pages listed below, or by using the keyword search tool below to find specific information within the annual report.-
 1
1 -
2
-
3
-
4
-
5
-
6
-
7
-
8
-
9
-
10
-
11
-
12
-
13
-
14
-
15
-
16
-
17
-
18
-
19
-
20
-
21
-
 22
22 -
 23
23 -
 24
24 -
 25
25 -
 26
26 -
 27
27 -
 28
28 -
 29
29 -
 30
30 -
 31
31 -
 32
32 -
 33
33 -
 34
34 -
 35
35 -
 36
36 -
 37
37 -
 38
38 -
 39
39 -
 40
40 -
 41
41 -
 42
42 -
43
-
44
-
45
-
46
-
47
-
48
-
49
-
50
-
51
-
52
-
53
-
54
-
55
-
56
-
57
-
58
-
59
-
60
-
61
-
62
-
63
-
64
-
65
-
66
-
67
-
68
-
69
-
70
-
71
-
72
-
73
-
74
-
75
-
76
-
77
-
78
-
79
-
80
-
81
-
82
-
83
-
84
-
85
-
86
-
87
-
88
-
89
-
90
-
91
-
92
-
93
-
94
-
95
 |
 |

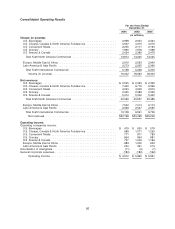
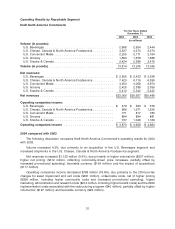
Operating Results by Reportable Segment
Kraft North America Commercial
For the Years Ended
December 31,
2004 2003 2002
(in millions)
Volume (in pounds):
U.S. Beverages ..................................... 2,968 2,634 2,444
U.S. Cheese, Canada & North America Foodservice ........... 4,527 4,373 4,273
U.S. Convenient Meals ................................ 2,205 2,171 2,164
U.S. Grocery ....................................... 1,690 1,678 1,688
U.S. Snacks & Cereals ................................ 2,424 2,389 2,476
Volume (in pounds) ................................... 13,814 13,245 13,045
Net revenues:
U.S. Beverages ..................................... $ 2,555 $ 2,433 $ 2,338
U.S. Cheese, Canada & North America Foodservice ........... 7,420 6,716 6,399
U.S. Convenient Meals ................................ 4,250 4,058 3,974
U.S. Grocery ....................................... 2,425 2,388 2,356
U.S. Snacks & Cereals ................................ 5,410 5,342 5,422
Net revenues ........................................ $22,060 $20,937 $20,489
Operating companies income:
U.S. Beverages ..................................... $ 479 $ 630 $ 576
U.S. Cheese, Canada & North America Foodservice ........... 989 1,271 1,255
U.S. Convenient Meals ................................ 771 817 783
U.S. Grocery ....................................... 894 894 881
U.S. Snacks & Cereals ................................ 737 1,046 1,169
Operating companies income ........................... $ 3,870 $ 4,658 $ 4,664
2004 compared with 2003
The following discussion compares Kraft North America Commercial’s operating results for 2004
with 2003.
Volume increased 4.3%, due primarily to an acquisition in the U.S. Beverages segment and
increased shipments in the U.S. Cheese, Canada & North America Foodservice segment.
Net revenues increased $1,123 million (5.4%), due primarily to higher volume/mix ($537 million),
higher net pricing ($312 million, reflecting commodity-driven price increases, partially offset by
increased promotional spending), favorable currency ($164 million) and the impact of acquisitions
($117 million).
Operating companies income decreased $788 million (16.9%), due primarily to the 2004 pre-tax
charges for asset impairment and exit costs ($391 million), unfavorable costs, net of higher pricing
($356 million, including higher commodity costs and increased promotional spending), higher
marketing, administration and research costs ($214 million, including higher benefit costs) and the 2004
implementation costs associated with the restructuring program ($40 million), partially offset by higher
volume/mix ($197 million) and favorable currency ($29 million).
31