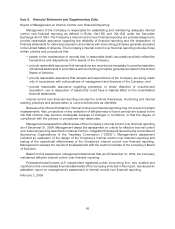
Kraft 2004 Annual Report Download - page 36
Download and view the complete annual report
Please find page 36 of the 2004 Kraft annual report below. You can navigate through the pages in the report by either clicking on the pages listed below, or by using the keyword search tool below to find specific information within the annual report.-
 1
1 -
2
-
3
-
4
-
5
-
6
-
7
-
8
-
9
-
10
-
11
-
12
-
13
-
14
-
15
-
16
-
17
-
18
-
19
-
20
-
21
-
22
-
23
-
24
-
25
-
 26
26 -
 27
27 -
 28
28 -
 29
29 -
 30
30 -
 31
31 -
 32
32 -
 33
33 -
 34
34 -
 35
35 -
 36
36 -
 37
37 -
 38
38 -
 39
39 -
 40
40 -
 41
41 -
 42
42 -
 43
43 -
 44
44 -
 45
45 -
 46
46 -
47
-
48
-
49
-
50
-
51
-
52
-
53
-
54
-
55
-
56
-
57
-
58
-
59
-
60
-
61
-
62
-
63
-
64
-
65
-
66
-
67
-
68
-
69
-
70
-
71
-
72
-
73
-
74
-
75
-
76
-
77
-
78
-
79
-
80
-
81
-
82
-
83
-
84
-
85
-
86
-
87
-
88
-
89
-
90
-
91
-
92
-
93
-
94
-
95
 |
 |

Net revenues decreased $80 million (1.5%), due to lower volume/mix ($105 million), partially offset
by higher pricing ($25 million, including the impact of increased promotional spending).
Operating companies income decreased $123 million (10.5%), due primarily to lower volume/mix
($102 million), higher fixed manufacturing costs ($70 million) and unfavorable costs, net of higher pricing
($38 million, including higher commodity costs and increased promotional spending), partially offset by
lower marketing, administration and research costs ($78 million) and the impact of 2002 pre-tax charges
for asset impairment and exit costs ($9 million).
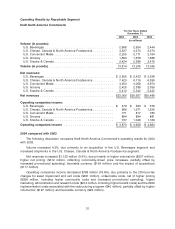
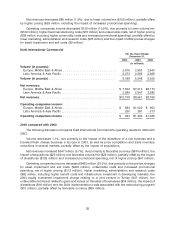
Kraft International Commercial
For the Years Ended
December 31,
2004 2003 2002
(in millions)
Volume (in pounds):
Europe, Middle East & Africa ............................. 2,915 2,953 2,943
Latin America & Asia Pacific .............................. 2,273 2,295 2,366
Volume (in pounds) ..................................... 5,188 5,248 5,309
Net revenues:
Europe, Middle East & Africa ............................. $ 7,522 $7,014 $6,174
Latin America & Asia Pacific .............................. 2,586 2,547 2,585
Net revenues .......................................... $10,108 $9,561 $8,759
Operating companies income:
Europe, Middle East & Africa ............................. $ 683 $1,002 $ 953
Latin America & Asia Pacific .............................. 250 391 513
Operating companies income ............................. $ 933 $1,393 $1,466
2004 compared with 2003
The following discussion compares Kraft International Commercial’s operating results for 2004 with
2003.
Volume decreased 1.1%, due primarily to the impact of the divestiture of a rice business and a
branded fresh cheese business in Europe in 2003, as well as price competition and trade inventory
reductions in several markets, partially offset by the impact of acquisitions.
Net revenues increased $547 million (5.7%), due primarily to favorable currency ($674 million), the
impact of acquisitions ($23 million) and favorable volume/mix ($23 million), partially offset by the impact
of divestitures ($126 million) and increased promotional spending, net of higher pricing ($47 million).
Operating companies income decreased $460 million (33.0%), due primarily to the pre-tax charges
for asset impairment and exit costs ($206 million), unfavorable costs and increased promotional
spending, net of higher pricing ($113 million), higher marketing, administration and research costs
($92 million, including higher benefit costs and infrastructure investment in developing markets), the
2004 equity investment impairment charge relating to a joint venture in Turkey ($47 million), the
unfavorable net impact related to gains and losses on the sales of businesses ($34 million), the impact of
divestitures ($18 million) and the 2004 implementation costs associated with the restructuring program
($10 million), partially offset by favorable currency ($69 million).
35