Kraft 2004 Annual Report Download - page 75
Download and view the complete annual report
Please find page 75 of the 2004 Kraft annual report below. You can navigate through the pages in the report by either clicking on the pages listed below, or by using the keyword search tool below to find specific information within the annual report.-
 1
1 -
2
-
3
-
4
-
5
-
6
-
7
-
8
-
9
-
10
-
11
-
12
-
13
-
14
-
15
-
16
-
17
-
18
-
19
-
20
-
21
-
22
-
23
-
24
-
25
-
26
-
27
-
28
-
29
-
30
-
31
-
32
-
33
-
34
-
35
-
36
-
37
-
38
-
39
-
40
-
41
-
42
-
43
-
44
-
45
-
46
-
47
-
48
-
49
-
50
-
51
-
52
-
53
-
54
-
55
-
56
-
57
-
58
-
59
-
60
-
61
-
62
-
63
-
64
-
 65
65 -
 66
66 -
 67
67 -
 68
68 -
 69
69 -
 70
70 -
 71
71 -
 72
72 -
 73
73 -
 74
74 -
 75
75 -
 76
76 -
 77
77 -
 78
78 -
 79
79 -
 80
80 -
 81
81 -
 82
82 -
 83
83 -
 84
84 -
 85
85 -
86
-
87
-
88
-
89
-
90
-
91
-
92
-
93
-
94
-
95
 |
 |

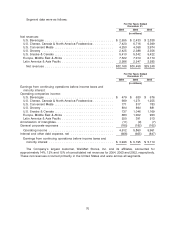
Geographic data for net revenues, total assets and long-lived assets (which consist of all
non-current assets, other than goodwill, other intangible assets, net and prepaid pension assets) were
as follows:
For the Years Ended
December 31,
2004 2003 2002
(in millions)
Net revenues:
United States ....................................... $20,057 $19,087 $18,961
Europe ........................................... 7,205 6,723 5,880
Other ............................................ 4,906 4,688 4,407
Total net revenues ................................. $32,168 $30,498 $29,248
Total assets:
United States ....................................... $44,293 $44,674 $44,406
Europe ........................................... 10,872 10,114 8,738
Other ............................................ 4,763 4,497 3,956
Total assets ...................................... $59,928 $59,285 $57,100
Long-lived assets:
United States ....................................... $ 5,998 $ 6,451 $ 6,382
Europe ........................................... 3,010 2,757 2,432
Other ............................................ 1,818 1,831 1,596
Total long-lived assets ............................... $10,826 $11,039 $10,410
Note 15. Benefit Plans:
In December 2003, the FASB issued a revised SFAS No. 132, ‘‘Employers’ Disclosures about
Pensions and Other Postretirement Benefits.’’ In accordance with the pronouncement, the Company
adopted the revised disclosure requirements of this pronouncement for its U.S. plans in 2003 and for its
non-U.S. plans in 2004.
The Company sponsors noncontributory defined benefit pension plans covering substantially all
U.S. employees. Pension coverage for employees of the Company’s non-U.S. subsidiaries is provided,
to the extent deemed appropriate, through separate plans, many of which are governed by local
statutory requirements. In addition, the Company’s U.S. and Canadian subsidiaries provide health care
and other benefits to substantially all retired employees. Health care benefits for retirees outside the
United States and Canada are generally covered through local government plans.
The plan assets and benefit obligations of the Company’s U.S. and Canadian pension plans are
measured at December 31 of each year and all other non-U.S. pension plans are measured at
September 30 of each year. The benefit obligations of the Company’s postretirement plans are
measured at December 31 of each year.
74