Kraft 2004 Annual Report Download - page 30
Download and view the complete annual report
Please find page 30 of the 2004 Kraft annual report below. You can navigate through the pages in the report by either clicking on the pages listed below, or by using the keyword search tool below to find specific information within the annual report.-
 1
1 -
2
-
3
-
4
-
5
-
6
-
7
-
8
-
9
-
10
-
11
-
12
-
13
-
14
-
15
-
16
-
17
-
18
-
19
-
 20
20 -
 21
21 -
 22
22 -
 23
23 -
 24
24 -
 25
25 -
 26
26 -
 27
27 -
 28
28 -
 29
29 -
 30
30 -
 31
31 -
 32
32 -
 33
33 -
 34
34 -
 35
35 -
 36
36 -
 37
37 -
 38
38 -
 39
39 -
 40
40 -
41
-
42
-
43
-
44
-
45
-
46
-
47
-
48
-
49
-
50
-
51
-
52
-
53
-
54
-
55
-
56
-
57
-
58
-
59
-
60
-
61
-
62
-
63
-
64
-
65
-
66
-
67
-
68
-
69
-
70
-
71
-
72
-
73
-
74
-
75
-
76
-
77
-
78
-
79
-
80
-
81
-
82
-
83
-
84
-
85
-
86
-
87
-
88
-
89
-
90
-
91
-
92
-
93
-
94
-
95
 |
 |
As discussed in Note 14 to the consolidated financial statements, the Company’s management
uses operating companies income, which is defined as operating income before general corporate
expenses and amortization of intangibles, to evaluate segment performance and allocate resources.
Management believes it is appropriate to disclose this measure to help investors analyze the business
performance and trends of the various business segments.
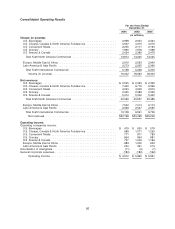
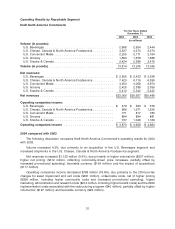
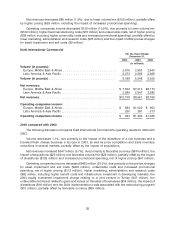
2004 compared with 2003
The following discussion compares consolidated operating results for 2004 with 2003.
Volume increased 509 million pounds (2.8%), due primarily to acquisitions and increased
shipments in the U.S. Cheese, Canada & North America Foodservice segment, partially offset by the
impact of divested businesses.
Net revenues increased $1,670 million (5.5%), due primarily to favorable currency ($838 million),
higher volume/mix ($560 million), higher net pricing ($265 million, reflecting commodity-driven pricing,
partially offset by increased promotional spending) and the impact of acquisitions ($140 million),
partially offset by the impact of divested businesses ($126 million).
Operating income decreased $1,248 million (21.3%), due primarily to the pre-tax charges for asset
impairment and exit costs ($597 million), unfavorable costs, net of higher pricing ($442 million, due
primarily to higher commodity costs and increased promotional spending), higher marketing,
administration and research costs ($306 million), the 2004 implementation costs associated with the
restructuring program ($50 million), the 2004 equity investment impairment charge relating to a joint
venture in Turkey ($47 million), the unfavorable net impact related to gains and losses on the sales of
businesses ($34 million), higher fixed manufacturing costs ($23 million, including higher benefit costs)
and the impact of divestitures ($18 million), partially offset by higher volume/mix ($187 million) and
favorable currency ($98 million).
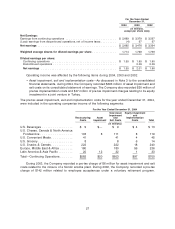
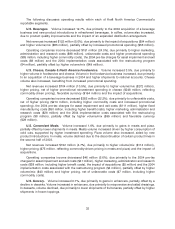
Currency movements increased net revenues by $838 million and operating income by $98 million.
These increases were due primarily to the weakness of the U.S. dollar against the euro and the Canadian
dollar.
The Company’s reported effective income tax rate decreased by 2.6 percentage points to 32.3%,
resulting from an $81 million favorable resolution of an outstanding tax item, the majority of which
occurred in the third quarter of 2004, and the reversal of $35 million of tax accruals that are no longer
required due to tax events that occurred during the first quarter of 2004.
Earnings from continuing operations of $2,669 million decreased $710 million (21.0%), due
primarily to lower operating income, partially offset by a lower effective income tax rate. Diluted EPS from
continuing operations, which was $1.55, decreased by 20.5%.
Earnings from discontinued operations, net of income tax, decreased $101 million, resulting in a net
loss of $4 million in 2004. The decrease was due primarily to pre-tax non-cash asset impairment charges
in 2004 of $107 million ($69 million after-tax) and an intangible pre-tax asset impairment charge of
$17 million ($11 million after-tax).
Net earnings of $2,665 million decreased $811 million (23.3%). Diluted EPS from net earnings,
which was $1.55, decreased by 22.9%.
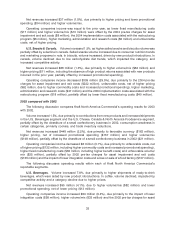
2003 compared with 2002
The following discussion compares consolidated operating results for 2003 with 2002.
Volume increased 139 million pounds (0.8%), due primarily to increased shipments in the
U.S. Beverages segment and the U.S. Cheese, Canada & North America Foodservice segment, growth
29