Kraft 2004 Annual Report Download - page 71
Download and view the complete annual report
Please find page 71 of the 2004 Kraft annual report below. You can navigate through the pages in the report by either clicking on the pages listed below, or by using the keyword search tool below to find specific information within the annual report.-
 1
1 -
2
-
3
-
4
-
5
-
6
-
7
-
8
-
9
-
10
-
11
-
12
-
13
-
14
-
15
-
16
-
17
-
18
-
19
-
20
-
21
-
22
-
23
-
24
-
25
-
26
-
27
-
28
-
29
-
30
-
31
-
32
-
33
-
34
-
35
-
36
-
37
-
38
-
39
-
40
-
41
-
42
-
43
-
44
-
45
-
46
-
47
-
48
-
49
-
50
-
51
-
52
-
53
-
54
-
55
-
56
-
57
-
58
-
59
-
60
-
 61
61 -
 62
62 -
 63
63 -
 64
64 -
 65
65 -
 66
66 -
 67
67 -
 68
68 -
 69
69 -
 70
70 -
 71
71 -
 72
72 -
 73
73 -
 74
74 -
 75
75 -
 76
76 -
 77
77 -
 78
78 -
 79
79 -
 80
80 -
 81
81 -
82
-
83
-
84
-
85
-
86
-
87
-
88
-
89
-
90
-
91
-
92
-
93
-
94
-
95
 |
 |

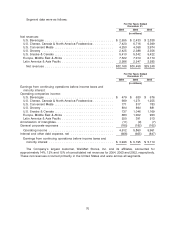
Segment data were as follows:
For the Years Ended
December 31,
2004 2003 2002
(in millions)
Net revenues:
U.S. Beverages ..................................... $ 2,555 $ 2,433 $ 2,338
U.S. Cheese, Canada & North America Foodservice ........... 7,420 6,716 6,399
U.S. Convenient Meals ................................ 4,250 4,058 3,974
U.S. Grocery ....................................... 2,425 2,388 2,356
U.S. Snacks & Cereals ................................ 5,410 5,342 5,422
Europe, Middle East & Africa ........................... 7,522 7,014 6,174
Latin America & Asia Pacific ............................ 2,586 2,547 2,585
Net revenues ..................................... $32,168 $30,498 $29,248
For the Years Ended
December 31,
2004 2003 2002
(in millions)
Earnings from continuing operations before income taxes and
minority interest:
Operating companies income:
U.S. Beverages ..................................... $ 479 $ 630 $ 576
U.S. Cheese, Canada & North America Foodservice ........... 989 1,271 1,255
U.S. Convenient Meals ................................ 771 817 783
U.S. Grocery ....................................... 894 894 881
U.S. Snacks & Cereals ................................ 737 1,046 1,169
Europe, Middle East & Africa ........................... 683 1,002 953
Latin America & Asia Pacific ............................ 250 391 513
Amortization of intangibles ............................... (11) (9) (7)
General corporate expenses ............................. (180) (182) (162)
Operating income ................................... 4,612 5,860 5,961
Interest and other debt expense, net ....................... (666) (665) (847)
Earnings from continuing operations before income taxes and
minority interest ................................... $ 3,946 $ 5,195 $ 5,114
The Company’s largest customer, Wal-Mart Stores, Inc. and its affiliates, accounted for
approximately 14%, 12% and 12% of consolidated net revenues for 2004, 2003 and 2002, respectively.
These net revenues occurred primarily in the United States and were across all segments.
70