Kraft 2004 Annual Report Download - page 39
Download and view the complete annual report
Please find page 39 of the 2004 Kraft annual report below. You can navigate through the pages in the report by either clicking on the pages listed below, or by using the keyword search tool below to find specific information within the annual report.-
 1
1 -
2
-
3
-
4
-
5
-
6
-
7
-
8
-
9
-
10
-
11
-
12
-
13
-
14
-
15
-
16
-
17
-
18
-
19
-
20
-
21
-
22
-
23
-
24
-
25
-
26
-
27
-
28
-
 29
29 -
 30
30 -
 31
31 -
 32
32 -
 33
33 -
 34
34 -
 35
35 -
 36
36 -
 37
37 -
 38
38 -
 39
39 -
 40
40 -
 41
41 -
 42
42 -
 43
43 -
 44
44 -
 45
45 -
 46
46 -
 47
47 -
 48
48 -
 49
49 -
50
-
51
-
52
-
53
-
54
-
55
-
56
-
57
-
58
-
59
-
60
-
61
-
62
-
63
-
64
-
65
-
66
-
67
-
68
-
69
-
70
-
71
-
72
-
73
-
74
-
75
-
76
-
77
-
78
-
79
-
80
-
81
-
82
-
83
-
84
-
85
-
86
-
87
-
88
-
89
-
90
-
91
-
92
-
93
-
94
-
95
 |
 |
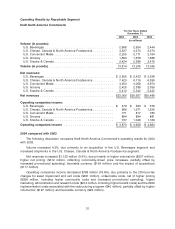
Mexico, Venezuela, and China, aided by new product introductions. Snacks volume also increased, as
biscuits volume growth in Brazil, Argentina, China and Australia, aided by new product introductions,
was partially offset by a decline in confectionery, which was impacted by economic weakness, trade
inventory reductions and price competition in Brazil. In cheese, volume increased, due to higher
shipments in Asia Pacific, benefiting from new products in Australia and promotional programs in the
Philippines, partially offset by declines in Latin America. In convenient meals, volume grew, benefiting
from gains in Argentina.
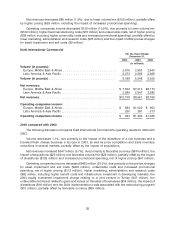
Net revenues decreased $38 million (1.5%), due primarily to unfavorable currency ($240 million),
the divestiture of a Latin American bakery ingredients business in 2002 ($68 million) and lower
volume/mix ($32 million), partially offset by higher pricing ($302 million, reflecting higher commodity and
currency devaluation-driven costs).
Operating companies income decreased $122 million (23.8%), due primarily to gains on sales of
businesses in 2002 ($72 million), higher marketing, administration and research costs ($71 million),
unfavorable currency ($39 million), lower volume/mix ($13 million) and the divestiture of a Latin
American bakery ingredients business in 2002 ($10 million), partially offset by higher pricing, net of cost
increases ($64 million) and the 2002 pre-tax charges for integration costs ($17 million).
Financial Review
Net Cash Provided by Operating Activities
Net cash provided by operating activities was $4.0 billion in 2004, $4.1 billion in 2003 and
$3.7 billion in 2002. The decrease in 2004 operating cash flows from 2003 was due primarily to lower net
earnings, cash payments associated with the restructuring program and higher pension contributions,
partially offset by a lower use of cash to fund working capital. The increase in 2003 operating cash flows
over 2002 was due primarily to a lower use of cash to fund working capital, partially offset by increased
pension contributions.
Net Cash Used in Investing Activities
One element of the growth strategy of the Company is to strengthen its brand portfolios through
disciplined programs of selective acquisitions and divestitures. The Company is constantly reviewing
potential acquisition candidates and from time to time sells businesses to accelerate the shift in its
portfolio toward businesses—whether global, regional or local—that offer the Company a sustainable
competitive advantage. The impact of any future acquisition or divestiture could have a material impact
on the Company’s cash flows.
During 2004, 2003 and 2002, net cash used in investing activities was $1.1 billion, $1.0 billion and
$1.1 billion, respectively. The increase in 2004 primarily reflected higher uses of cash for the purchase of
businesses and the reduction of cash received from the sales of businesses, partially offset by lower
capital expenditures. The decrease in 2003 primarily reflected lower capital expenditures and lower
purchases of businesses, partially offset by the reduction in the cash received from the sales of
businesses.
Capital expenditures, which were funded by operating activities, were $1.0 billion, $1.1 billion and
$1.2 billion in 2004, 2003 and 2002, respectively. The 2004 capital expenditures were primarily to
modernize manufacturing facilities, implement the restructuring program and expand production
capacity for growing product lines. In 2005, capital expenditures are currently expected to be at or
slightly above 2004 expenditures, including capital expenditures required for the restructuring program.
These expenditures are expected to be funded from operations.
As previously discussed, during the fourth quarter of 2004, the Company announced the sale of its
sugar confectionery, U.K. desserts and yogurt businesses for approximately $1.5 billion, $135 million
38