Kraft 2004 Annual Report Download - page 50
Download and view the complete annual report
Please find page 50 of the 2004 Kraft annual report below. You can navigate through the pages in the report by either clicking on the pages listed below, or by using the keyword search tool below to find specific information within the annual report.-
 1
1 -
2
-
3
-
4
-
5
-
6
-
7
-
8
-
9
-
10
-
11
-
12
-
13
-
14
-
15
-
16
-
17
-
18
-
19
-
20
-
21
-
22
-
23
-
24
-
25
-
26
-
27
-
28
-
29
-
30
-
31
-
32
-
33
-
34
-
35
-
36
-
37
-
38
-
39
-
 40
40 -
 41
41 -
 42
42 -
 43
43 -
 44
44 -
 45
45 -
 46
46 -
 47
47 -
 48
48 -
 49
49 -
 50
50 -
 51
51 -
 52
52 -
 53
53 -
 54
54 -
 55
55 -
 56
56 -
 57
57 -
 58
58 -
 59
59 -
 60
60 -
61
-
62
-
63
-
64
-
65
-
66
-
67
-
68
-
69
-
70
-
71
-
72
-
73
-
74
-
75
-
76
-
77
-
78
-
79
-
80
-
81
-
82
-
83
-
84
-
85
-
86
-
87
-
88
-
89
-
90
-
91
-
92
-
93
-
94
-
95
 |
 |

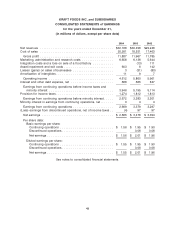
KRAFT FOODS INC. and SUBSIDIARIES
CONSOLIDATED STATEMENTS of EARNINGS
for the years ended December 31,
(in millions of dollars, except per share data)
2004 2003 2002
Net revenues ........................................ $32,168 $30,498 $29,248
Cost of sales ........................................ 20,281 18,531 17,463
Gross profit ........................................ 11,887 11,967 11,785
Marketing, administration and research costs ................. 6,658 6,136 5,644
Integration costs and a loss on sale of a food factory ........... (13) 111
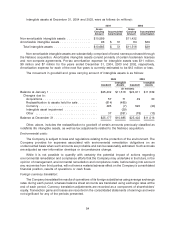
Asset impairment and exit costs ........................... 603 6 142
Losses (gains) on sales of businesses ...................... 3 (31) (80)
Amortization of intangibles ............................... 11 9 7
Operating income ................................... 4,612 5,860 5,961
Interest and other debt expense, net ....................... 666 665 847
Earnings from continuing operations before income taxes and
minority interest ................................... 3,946 5,195 5,114
Provision for income taxes ............................... 1,274 1,812 1,813
Earnings from continuing operations before minority interest ..... 2,672 3,383 3,301
Minority interest in earnings from continuing operations, net ....... 3 4 4
Earnings from continuing operations ...................... 2,669 3,379 3,297
(Loss) earnings from discontinued operations, net of income taxes . . (4) 97 97
Net earnings ....................................... $ 2,665 $ 3,476 $ 3,394
Per share data:
Basic earnings per share:
Continuing operations ............................. $ 1.56 $ 1.95 $ 1.90
Discontinued operations ............................ 0.06 0.06
Net earnings .................................... $ 1.56 $ 2.01 $ 1.96
Diluted earnings per share:
Continuing operations ............................. $ 1.55 $ 1.95 $ 1.90
Discontinued operations ............................ 0.06 0.06
Net earnings .................................... $ 1.55 $ 2.01 $ 1.96
See notes to consolidated financial statements.
49