Kraft 2004 Annual Report Download - page 37
Download and view the complete annual report
Please find page 37 of the 2004 Kraft annual report below. You can navigate through the pages in the report by either clicking on the pages listed below, or by using the keyword search tool below to find specific information within the annual report.-
 1
1 -
2
-
3
-
4
-
5
-
6
-
7
-
8
-
9
-
10
-
11
-
12
-
13
-
14
-
15
-
16
-
17
-
18
-
19
-
20
-
21
-
22
-
23
-
24
-
25
-
26
-
 27
27 -
 28
28 -
 29
29 -
 30
30 -
 31
31 -
 32
32 -
 33
33 -
 34
34 -
 35
35 -
 36
36 -
 37
37 -
 38
38 -
 39
39 -
 40
40 -
 41
41 -
 42
42 -
 43
43 -
 44
44 -
 45
45 -
 46
46 -
 47
47 -
48
-
49
-
50
-
51
-
52
-
53
-
54
-
55
-
56
-
57
-
58
-
59
-
60
-
61
-
62
-
63
-
64
-
65
-
66
-
67
-
68
-
69
-
70
-
71
-
72
-
73
-
74
-
75
-
76
-
77
-
78
-
79
-
80
-
81
-
82
-
83
-
84
-
85
-
86
-
87
-
88
-
89
-
90
-
91
-
92
-
93
-
94
-
95
 |
 |
The following discusses operating results within each of Kraft International Commercial’s reportable
segments.
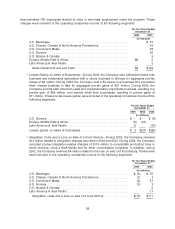
Europe, Middle East & Africa. Volume decreased 1.3%, due primarily to the divestiture of a rice
business and a branded fresh cheese business in Europe in 2003, price competition in France and trade
inventory reductions in Russia, partially offset by the impact of acquisitions and volume growth in
Germany, Austria, Italy and Romania. Cheese volume declined, impacted by the divestiture of a branded
fresh cheese business in Europe in 2003, partially offset by increased cream cheese shipments in
Germany, Italy and the United Kingdom, and higher process cheese shipments in the United Kingdom.
Beverages volume also declined, driven by price competition in coffee in France and lower shipments of
refreshment beverages in the Middle East. Convenient meals volume declined, impacted by the
divestiture of a rice business in Europe in 2003. In grocery, volume declined across several markets,
including Germany and Italy, partially offset by increased volume in Egypt, due to an acquisition. Snacks
volume increased, as gains in biscuits, benefiting from acquisitions, and new confectionery product
introductions across the segment, were partially offset by trade inventory reductions in Russia.
Net revenues increased $508 million (7.2%), due primarily to favorable currency ($649 million),
favorable volume/mix ($48 million) and the impact of acquisitions ($21 million), partially offset by the
impact of divestitures ($115 million) and lower pricing and increased promotional spending
($95 million).
Operating companies income decreased $319 million (31.8%), due primarily to the pre-tax charges
for asset impairment and exit costs ($174 million), lower pricing and increased promotional spending
($92 million), higher marketing, administration and research costs ($49 million, including higher benefit
costs as well as infrastructure investment in developing markets), the equity investment impairment
charge relating to a joint venture in Turkey ($47 million), lower gains on the sales of businesses
($26 million), the impact of divestitures ($17 million) and the 2004 implementation costs associated with
the restructuring program ($9 million), partially offset by favorable currency ($78 million) and favorable
volume/mix ($15 million).
Latin America & Asia Pacific. Volume decreased 1.0%, due primarily to lower shipments in
Mexico, Peru and Venezuela, partially offset by growth in Brazil and China. Snacks volume declined,
impacted by price competition and trade inventory reductions in Venezuela and Peru. In grocery, volume
declined across several markets, including Peru, Australia and the Philippines. Cheese volume
increased, due primarily to gains across several markets, including Japan, Australia and the Philippines.
Beverages volume also increased, due primarily to gains in Brazil and China, partially offset by increased
competitive activity in Mexico.
Net revenues increased $39 million (1.5%), due primarily to higher pricing ($48 million, reflecting
devaluation-driven cost increases, net of increased promotional spending) and favorable currency
($25 million), partially offset by lower volume/mix ($25 million) and the impact of divestitures
($11 million).
Operating companies income decreased $141 million (36.1%), due primarily to higher marketing,
administration and research costs ($43 million), the 2004 pre-tax charges for asset impairment and exit
costs ($32 million), lower volume/mix ($25 million), unfavorable costs, net of higher pricing ($21 million,
including increased promotional spending), unfavorable currency ($9 million) and the 2004 pre-tax loss
on the sale of a snack nuts business in Brazil ($8 million).
2003 compared with 2002
The following discussion compares Kraft International Commercial’s operating results for 2003 with
2002.
36