Honeywell 2009 Annual Report Download - page 99
Download and view the complete annual report
Please find page 99 of the 2009 Honeywell annual report below. You can navigate through the pages in the report by either clicking on the pages listed below, or by using the keyword search tool below to find specific information within the annual report.-
 1
1 -
2
-
3
-
4
-
5
-
6
-
7
-
8
-
9
-
10
-
11
-
12
-
13
-
14
-
15
-
16
-
17
-
18
-
19
-
20
-
21
-
22
-
23
-
24
-
25
-
26
-
27
-
28
-
29
-
30
-
31
-
32
-
33
-
34
-
35
-
36
-
37
-
38
-
39
-
40
-
41
-
42
-
43
-
44
-
45
-
46
-
47
-
48
-
49
-
50
-
51
-
52
-
53
-
54
-
55
-
56
-
57
-
58
-
59
-
60
-
61
-
62
-
63
-
64
-
65
-
66
-
67
-
68
-
69
-
70
-
71
-
72
-
73
-
74
-
75
-
76
-
77
-
78
-
79
-
80
-
81
-
82
-
83
-
84
-
85
-
86
-
87
-
88
-
 89
89 -
 90
90 -
 91
91 -
 92
92 -
 93
93 -
 94
94 -
 95
95 -
 96
96 -
 97
97 -
 98
98 -
 99
99 -
 100
100 -
 101
101 -
 102
102 -
 103
103 -
 104
104 -
 105
105 -
 106
106 -
 107
107 -
 108
108 -
 109
109 -
110
-
111
-
112
-
113
-
114
-
115
-
116
-
117
-
118
-
119
-
120
-
121
-
122
-
123
-
124
-
125
-
126
-
127
-
128
-
129
-
130
-
131
-
132
-
133
-
134
-
135
-
136
-
137
-
138
-
139
-
140
-
141
-
142
-
143
-
144
-
145
-
146
-
147
-
148
-
149
-
150
-
151
-
152
-
153
-
154
-
155
-
156
-
157
-
158
-
159
-
160
-
161
-
162
-
163
-
164
-
165
-
166
-
167
-
168
-
169
-
170
-
171
-
172
-
173
-
174
-
175
-
176
-
177
-
178
-
179
-
180
 |
 |

HONEYWELL INTERNATIONAL INC.
NOTES TO FINANCIAL STATEMENTS—(Continued)
(Dollars in millions, except per share amounts)
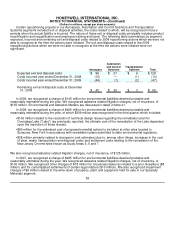
program costs being recognized as Interest and other financial charges in the Consolidated Statement of
Operations on a prospective basis.
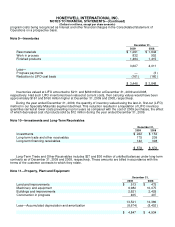
Note 9—Inventories
December 31,
2009 2008
Raw materials $ 1,291 $ 1,644
Work in process 832 952
Finished products 1,484 1,415
3,607 4,011
Less—
Progress payments — (3)
Reduction to LIFO cost basis (161) (160)
$ 3,446 $ 3,848
Inventories valued at LIFO amounted to $211 and $269 million at December 31, 2009 and 2008,
respectively. Had such LIFO inventories been valued at current costs, their carrying values would have been
approximately $161 and $160 million higher at December 31, 2009 and 2008, respectively.
During the year ended December 31, 2009, the quantity of inventory valued using the last-in, first-out (LIFO)
method in our Specialty Materials segment declined. This reduction resulted in a liquidation of LIFO inventory
quantities carried at lower costs prevailing in prior years as compared with the cost of 2009 purchases, the effect
of which decreased cost of products sold by $12 million during the year ended December 31, 2009.
Note 10—Investments and Long-Term Receivables
December 31,
2009 2008
Investments $ 262 $ 153
Long-term trade and other receivables 175 209
Long-term financing receivables 142 308
$ 579 $ 670
Long-Term Trade and Other Receivables includes $27 and $36 million of unbilled balances under long-term
contracts as of December 31, 2009 and 2008, respectively. These amounts are billed in accordance with the
terms of the customer contracts to which they relate.
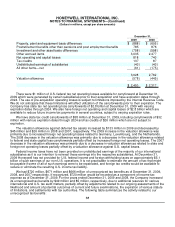
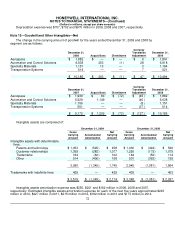
Note 11—Property, Plant and Equipment
December 31,
2009 2008
Land and improvements $ 513 $ 475
Machinery and equipment 9,982 10,075
Buildings and improvements 2,621 2,429
Construction in progress 405 407
13,521 13,386
Less—Accumulated depreciation and amortization (8,674) (8,452)
$ 4,847 $ 4,934