Honeywell 2009 Annual Report Download - page 66
Download and view the complete annual report
Please find page 66 of the 2009 Honeywell annual report below. You can navigate through the pages in the report by either clicking on the pages listed below, or by using the keyword search tool below to find specific information within the annual report.-
 1
1 -
2
-
3
-
4
-
5
-
6
-
7
-
8
-
9
-
10
-
11
-
12
-
13
-
14
-
15
-
16
-
17
-
18
-
19
-
20
-
21
-
22
-
23
-
24
-
25
-
26
-
27
-
28
-
29
-
30
-
31
-
32
-
33
-
34
-
35
-
36
-
37
-
38
-
39
-
40
-
41
-
42
-
43
-
44
-
45
-
46
-
47
-
48
-
49
-
50
-
51
-
52
-
53
-
54
-
55
-
 56
56 -
 57
57 -
 58
58 -
 59
59 -
 60
60 -
 61
61 -
 62
62 -
 63
63 -
 64
64 -
 65
65 -
 66
66 -
 67
67 -
 68
68 -
 69
69 -
 70
70 -
 71
71 -
 72
72 -
 73
73 -
 74
74 -
 75
75 -
 76
76 -
77
-
78
-
79
-
80
-
81
-
82
-
83
-
84
-
85
-
86
-
87
-
88
-
89
-
90
-
91
-
92
-
93
-
94
-
95
-
96
-
97
-
98
-
99
-
100
-
101
-
102
-
103
-
104
-
105
-
106
-
107
-
108
-
109
-
110
-
111
-
112
-
113
-
114
-
115
-
116
-
117
-
118
-
119
-
120
-
121
-
122
-
123
-
124
-
125
-
126
-
127
-
128
-
129
-
130
-
131
-
132
-
133
-
134
-
135
-
136
-
137
-
138
-
139
-
140
-
141
-
142
-
143
-
144
-
145
-
146
-
147
-
148
-
149
-
150
-
151
-
152
-
153
-
154
-
155
-
156
-
157
-
158
-
159
-
160
-
161
-
162
-
163
-
164
-
165
-
166
-
167
-
168
-
169
-
170
-
171
-
172
-
173
-
174
-
175
-
176
-
177
-
178
-
179
-
180
 |
 |

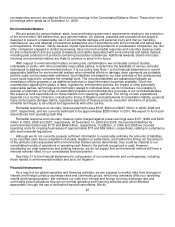
31, 2009 compared with $6.0 billion at December 31, 2008. This increase of $1.6 billion is due primarily to lower
discount rates in our plans partially offset by asset gains due to the performance of the equity markets in 2009.
The net losses at December 31, 2009 principally result from lower discount rates in 2009 and actual plan asset
returns below expected rates of return in 2008. As discussed in detail in Note 22 to the financial statements such
losses have been recognized as a component of other comprehensive income (loss), net of tax. In the future we
will continue to systematically recognize such net losses in net periodic pension expense. We use the market-
related value of plan assets reflecting changes in the fair value of plan assets over a three-year period. Further,
net losses in excess of 10 percent of the greater of the market-related value of plan assets or the plans' projected
benefit obligation (the corridor) are recognized over a six-year period.
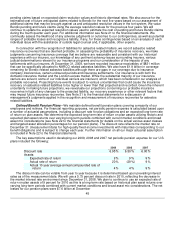
Changes in net periodic pension expense may occur in the future due to changes in our expected rate of
return on plan assets and discount rate resulting from economic events. The following table highlights the
sensitivity of our U.S. pension obligations and expense to changes in these assumptions, assuming all other
assumptions remain constant:
Change in Assumption Impact on Annual
Pension Expense Impact on PBO
0.25 percentage point decrease in discount rate Increase $50 million Increase $350 million
0.25 percentage point increase in discount rate Decrease $50 million Decrease $350 million
0.25 percentage point decrease in expected rate of
return on assets Increase $27 million —
0.25 percentage point increase in expected rate of
return on assets Decrease $27 million —
Net periodic pension expense for our pension plans is expected to be approximately $820 million in 2010, a
$712 million increase from 2009 due principally to an increase in the amortization of net losses in our U.S. plans.
The increase in the amortization of net losses results principally from asset losses due to the poor performance
of the equity markets in 2008.
In 2009, 2008 and 2007 we were not required to make contributions to satisfy minimum statutory funding
requirements in our U.S. pension plans. However, we made voluntary contributions of $740, $242 and $42 million
to our U.S. pension plans in 2009, 2008 and 2007, respectively, primarily to improve the funded status of our
plans which deteriorated during 2008 due to the significant asset losses resulting from the poor performance of
the equity markets. During 2010, we plan to make additional voluntary contributions of Honeywell common stock
to our U.S. plans to improve the funded status of our plans. Beyond 2010, minimum statutory funding
requirements for our U.S. pension plans may become significant. However, the actual amounts required to be
contributed are dependent upon, among other things, interest rates, underlying asset returns and the impact of
legislative or regulatory changes related to pension funding obligations. We also expect to contribute
approximately $150 to our non-U.S. defined benefit pension plans in 2010 to satisfy regulatory funding standards.
Long-Lived Assets (including Tangible and Definite-Lived Intangible Assets)—To conduct our global
business operations and execute our business strategy, we acquire tangible and intangible assets, including
property, plant and equipment and definite-lived intangible assets. At December 31, 2009, the net carrying
amount of these long-lived assets totaled $6.6 billion. The determination of useful lives (for depreciation/
amortization purposes) and whether or not these assets are impaired involves the use of accounting estimates
and assumptions, changes in which could materially impact our financial condition or operating performance if
actual results differ from such estimates and assumptions. We periodically evaluate the recoverability of the
carrying amount of our long-lived assets whenever events or changes in circumstances indicate that the carrying
amount of a long-lived asset group may not be fully recoverable. The principal factors we consider in deciding
when to perform an impairment review are as follows:
• significant under-performance (i.e., declines in sales, earnings or cash flows) of a business or product line in
relation to expectations;
•
annual operating plans or five-year strategic plans that indicate an unfavorable trend in operating
performance of a business or product line;
•
significant negative industry or economic trends; and
46