Honeywell 2009 Annual Report Download - page 139
Download and view the complete annual report
Please find page 139 of the 2009 Honeywell annual report below. You can navigate through the pages in the report by either clicking on the pages listed below, or by using the keyword search tool below to find specific information within the annual report.-
 1
1 -
2
-
3
-
4
-
5
-
6
-
7
-
8
-
9
-
10
-
11
-
12
-
13
-
14
-
15
-
16
-
17
-
18
-
19
-
20
-
21
-
22
-
23
-
24
-
25
-
26
-
27
-
28
-
29
-
30
-
31
-
32
-
33
-
34
-
35
-
36
-
37
-
38
-
39
-
40
-
41
-
42
-
43
-
44
-
45
-
46
-
47
-
48
-
49
-
50
-
51
-
52
-
53
-
54
-
55
-
56
-
57
-
58
-
59
-
60
-
61
-
62
-
63
-
64
-
65
-
66
-
67
-
68
-
69
-
70
-
71
-
72
-
73
-
74
-
75
-
76
-
77
-
78
-
79
-
80
-
81
-
82
-
83
-
84
-
85
-
86
-
87
-
88
-
89
-
90
-
91
-
92
-
93
-
94
-
95
-
96
-
97
-
98
-
99
-
100
-
101
-
102
-
103
-
104
-
105
-
106
-
107
-
108
-
109
-
110
-
111
-
112
-
113
-
114
-
115
-
116
-
117
-
118
-
119
-
120
-
121
-
122
-
123
-
124
-
125
-
126
-
127
-
128
-
 129
129 -
 130
130 -
 131
131 -
 132
132 -
 133
133 -
 134
134 -
 135
135 -
 136
136 -
 137
137 -
 138
138 -
 139
139 -
 140
140 -
 141
141 -
 142
142 -
 143
143 -
 144
144 -
 145
145 -
 146
146 -
 147
147 -
 148
148 -
 149
149 -
150
-
151
-
152
-
153
-
154
-
155
-
156
-
157
-
158
-
159
-
160
-
161
-
162
-
163
-
164
-
165
-
166
-
167
-
168
-
169
-
170
-
171
-
172
-
173
-
174
-
175
-
176
-
177
-
178
-
179
-
180
 |
 |
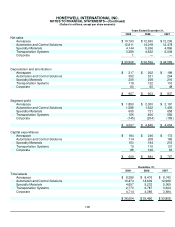
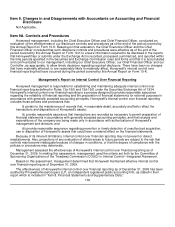
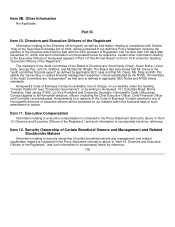
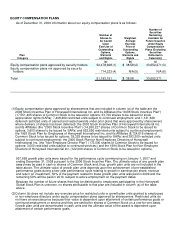
HONEYWELL INTERNATIONAL INC.
NOTES TO FINANCIAL STATEMENTS—(Continued)
(Dollars in millions, except per share amounts)
Years Ended December 31,
2009 2008 2007
Net sales
Aerospace $ 10,763 $ 12,650 $ 12,236
Automation and Control Solutions 12,611 14,018 12,478
Specialty Materials 4,144 5,266 4,866
Transportation Systems 3,389 4,622 5,009
Corporate 1 — —
$ 30,908 $ 36,556 $ 34,589
Depreciation and amortization
Aerospace $ 217 $ 202 $ 199
Automation and Control Solutions 352 321 264
Specialty Materials 209 208 216
Transportation Systems 119 122 110
Corporate 60 50 48
$ 957 $ 903 $ 837
Segment profit
Aerospace $ 1,893 $ 2,300 $ 2,197
Automation and Control Solutions 1,588 1,622 1,405
Specialty Materials 605 721 658
Transportation Systems 156 406 583
Corporate (145) (204) (189)
$ 4,097 $ 4,845 $ 4,654
Capital expenditures
Aerospace $ 184 $ 246 $ 172
Automation and Control Solutions 114 208 186
Specialty Materials 153 194 215
Transportation Systems 70 110 131
Corporate 88 126 63
$ 609 $ 884 $ 767
December 31,
2009 2008 2007
Total assets
Aerospace $ 8,386 $ 8,476 $ 8,743
Automation and Control Solutions 15,474 14,609 12,999
Specialty Materials 4,657 5,232 5,065
Transportation Systems 2,773 2,787 3,304
Corporate 4,714 4,386 3,694
$ 36,004 $ 35,490 $ 33,805
100