Honeywell 2009 Annual Report Download - page 35
Download and view the complete annual report
Please find page 35 of the 2009 Honeywell annual report below. You can navigate through the pages in the report by either clicking on the pages listed below, or by using the keyword search tool below to find specific information within the annual report.-
 1
1 -
2
-
3
-
4
-
5
-
6
-
7
-
8
-
9
-
10
-
11
-
12
-
13
-
14
-
15
-
16
-
17
-
18
-
19
-
20
-
21
-
22
-
23
-
24
-
 25
25 -
 26
26 -
 27
27 -
 28
28 -
 29
29 -
 30
30 -
 31
31 -
 32
32 -
 33
33 -
 34
34 -
 35
35 -
 36
36 -
 37
37 -
 38
38 -
 39
39 -
 40
40 -
 41
41 -
 42
42 -
 43
43 -
 44
44 -
 45
45 -
46
-
47
-
48
-
49
-
50
-
51
-
52
-
53
-
54
-
55
-
56
-
57
-
58
-
59
-
60
-
61
-
62
-
63
-
64
-
65
-
66
-
67
-
68
-
69
-
70
-
71
-
72
-
73
-
74
-
75
-
76
-
77
-
78
-
79
-
80
-
81
-
82
-
83
-
84
-
85
-
86
-
87
-
88
-
89
-
90
-
91
-
92
-
93
-
94
-
95
-
96
-
97
-
98
-
99
-
100
-
101
-
102
-
103
-
104
-
105
-
106
-
107
-
108
-
109
-
110
-
111
-
112
-
113
-
114
-
115
-
116
-
117
-
118
-
119
-
120
-
121
-
122
-
123
-
124
-
125
-
126
-
127
-
128
-
129
-
130
-
131
-
132
-
133
-
134
-
135
-
136
-
137
-
138
-
139
-
140
-
141
-
142
-
143
-
144
-
145
-
146
-
147
-
148
-
149
-
150
-
151
-
152
-
153
-
154
-
155
-
156
-
157
-
158
-
159
-
160
-
161
-
162
-
163
-
164
-
165
-
166
-
167
-
168
-
169
-
170
-
171
-
172
-
173
-
174
-
175
-
176
-
177
-
178
-
179
-
180
 |
 |

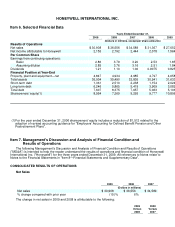
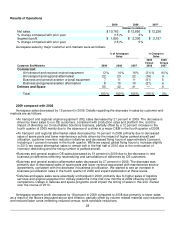
Net Income Attributable to Honeywell
2009 2008 2007
(Dollars in millions, except
per share amounts)
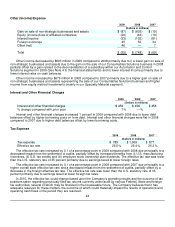
Net income attributable to Honeywell $ 2,153 $ 2,792 $ 2,444
Earnings per share of common stock—assuming dilution $ 2.85 $ 3.76 $ 3.16
The decrease of $0.91 in earnings per share of common stock—assuming dilution in 2009 compared with
2008 primarily relates to a decrease in segment profit in each of our business segments, decreased Other
(Income) Expense, as discussed above, and an increase in the number of shares outstanding partially offset by
lower repositioning charges.
The increase of $0.60 in earnings per share of common stock—assuming dilution in 2008 compared with
2007 primarily relates to (i) the gain on sale of the Consumables Solutions business, (ii) lower pension and other
post retirement expense, (iii) an increase in segment profit (most significantly in Automation and Control
Solutions and Aerospace, partially offset by a decline in Transportation Systems segment profit) and (iv) a
reduction in the number of shares outstanding due to share repurchases, partially offset by increased
repositioning costs.
For further discussion of segment results, see "Review of Business Segments".
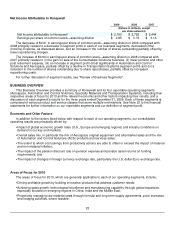
BUSINESS OVERVIEW
This Business Overview provides a summary of Honeywell and its four reportable operating segments
(Aerospace, Automation and Control Solutions, Specialty Materials and Transportation Systems), including their
respective areas of focus for 2010 and the relevant economic and other factors impacting their results, and a
discussion of each segment's results for the three years ended December 31, 2009. Each of these segments is
comprised of various product and service classes that serve multiple end markets. See Note 23 to the financial
statements for further information on our reportable segments and our definition of segment profit.
Economic and Other Factors
In addition to the factors listed below with respect to each of our operating segments, our consolidated
operating results are principally driven by:
• Impact of global economic growth rates (U.S., Europe and emerging regions) and industry conditions on
demand in our key end markets;
•
Overall sales mix, in particular the mix of Aerospace original equipment and aftermarket sales and the mix
of Automation and Control Solutions (ACS) products and services sales;
•
The extent to which cost savings from productivity actions are able to offset or exceed the impact of material
and non-material inflation;
•
The impact of the pension discount rate on pension expense and pension asset returns on funding
requirements; and
•
The impact of changes in foreign currency exchange rate, particularly the U.S. dollar-Euro exchange rate.
Areas of Focus for 2010
The areas of focus for 2010, which are generally applicable to each of our operating segments, include:
• Driving profitable growth by building innovative products that address customer needs;
•
Achieving sales growth, technological excellence and manufacturing capability through global expansion,
especially focused on emerging regions in China, India and the Middle East;
•
Proactively managing raw material costs through formula and long term supply agreements, price increases
and hedging activities, where feasible;
25