Honeywell 2009 Annual Report Download - page 114
Download and view the complete annual report
Please find page 114 of the 2009 Honeywell annual report below. You can navigate through the pages in the report by either clicking on the pages listed below, or by using the keyword search tool below to find specific information within the annual report.-
 1
1 -
2
-
3
-
4
-
5
-
6
-
7
-
8
-
9
-
10
-
11
-
12
-
13
-
14
-
15
-
16
-
17
-
18
-
19
-
20
-
21
-
22
-
23
-
24
-
25
-
26
-
27
-
28
-
29
-
30
-
31
-
32
-
33
-
34
-
35
-
36
-
37
-
38
-
39
-
40
-
41
-
42
-
43
-
44
-
45
-
46
-
47
-
48
-
49
-
50
-
51
-
52
-
53
-
54
-
55
-
56
-
57
-
58
-
59
-
60
-
61
-
62
-
63
-
64
-
65
-
66
-
67
-
68
-
69
-
70
-
71
-
72
-
73
-
74
-
75
-
76
-
77
-
78
-
79
-
80
-
81
-
82
-
83
-
84
-
85
-
86
-
87
-
88
-
89
-
90
-
91
-
92
-
93
-
94
-
95
-
96
-
97
-
98
-
99
-
100
-
101
-
102
-
103
-
 104
104 -
 105
105 -
 106
106 -
 107
107 -
 108
108 -
 109
109 -
 110
110 -
 111
111 -
 112
112 -
 113
113 -
 114
114 -
 115
115 -
 116
116 -
 117
117 -
 118
118 -
 119
119 -
 120
120 -
 121
121 -
 122
122 -
 123
123 -
 124
124 -
125
-
126
-
127
-
128
-
129
-
130
-
131
-
132
-
133
-
134
-
135
-
136
-
137
-
138
-
139
-
140
-
141
-
142
-
143
-
144
-
145
-
146
-
147
-
148
-
149
-
150
-
151
-
152
-
153
-
154
-
155
-
156
-
157
-
158
-
159
-
160
-
161
-
162
-
163
-
164
-
165
-
166
-
167
-
168
-
169
-
170
-
171
-
172
-
173
-
174
-
175
-
176
-
177
-
178
-
179
-
180
 |
 |

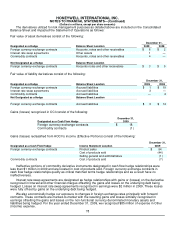
HONEYWELL INTERNATIONAL INC.
NOTES TO FINANCIAL STATEMENTS—(Continued)
(Dollars in millions, except per share amounts)
The fair value of each option award is estimated on the date of grant using the Black-Scholes option-pricing
model. Expected volatility is based on implied volatilities from traded options on Honeywell common stock. We
used a Monte Carlo simulation model to derive an expected term. Such model uses historical data to estimate
option exercise activity and post-vest termination behavior. The expected term represents an estimate of the time
options are expected to remain outstanding. The risk-free rate for periods within the contractual life of the option
is based on the U.S. treasury yield curve in effect at the time of grant.
Compensation cost on a pre-tax basis related to stock options recognized in operating results (included in
selling, general and administrative expenses) in 2009, 2008 and 2007 was $39, $51 and $65 million,
respectively. The associated future income tax benefit recognized in 2009, 2008 and 2007 was $13, $19 and $25
million, respectively.
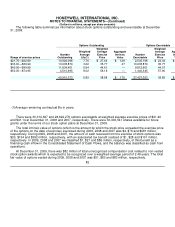
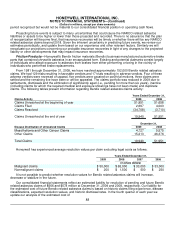
The following table sets forth fair value per share information, including related weighted-average
assumptions, used to determine compensation cost:
Years Ended December 31,
2009 2008 2007
Weighted average fair value per share of options granted
during the year(1) $ 6.73 $ 13.81 $ 10.27
Assumptions:
Expected annual dividend yield 4.26% 1.88% 2.09%
Expected volatility 35.78% 26.35% 20.18%
Risk-free rate of return 2.53% 3.09% 4.66%
Expected option term (years) 5.8 5.2 5.3
(1) Estimated on date of grant using Black-Scholes option-pricing model.
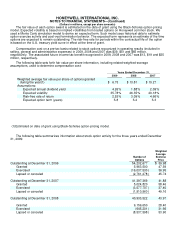
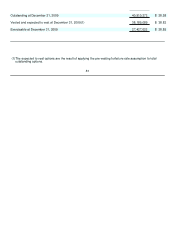
The following table summarizes information about stock option activity for the three years ended December
31, 2009:
Number of
Options
Weighted
Average
Exercise
Price
Outstanding at December 31, 2006 54,232,677 $ 39.98
Granted 5,963,500 47.59
Exercised (16,037,530) 36.95
Lapsed or canceled (2,761,278) 45.74
Outstanding at December 31, 2007 41,397,369 41.88
Granted 5,024,820 58.46
Exercised (3,577,707) 37.40
Lapsed or canceled (1,910,960) 49.16
Outstanding at December 31, 2008 40,933,522 43.97
Granted 9,159,650 28.40
Exercised (645,201) 31.66
Lapsed or canceled (8,537,598) 53.90