Honeywell 2009 Annual Report Download - page 135
Download and view the complete annual report
Please find page 135 of the 2009 Honeywell annual report below. You can navigate through the pages in the report by either clicking on the pages listed below, or by using the keyword search tool below to find specific information within the annual report.-
 1
1 -
2
-
3
-
4
-
5
-
6
-
7
-
8
-
9
-
10
-
11
-
12
-
13
-
14
-
15
-
16
-
17
-
18
-
19
-
20
-
21
-
22
-
23
-
24
-
25
-
26
-
27
-
28
-
29
-
30
-
31
-
32
-
33
-
34
-
35
-
36
-
37
-
38
-
39
-
40
-
41
-
42
-
43
-
44
-
45
-
46
-
47
-
48
-
49
-
50
-
51
-
52
-
53
-
54
-
55
-
56
-
57
-
58
-
59
-
60
-
61
-
62
-
63
-
64
-
65
-
66
-
67
-
68
-
69
-
70
-
71
-
72
-
73
-
74
-
75
-
76
-
77
-
78
-
79
-
80
-
81
-
82
-
83
-
84
-
85
-
86
-
87
-
88
-
89
-
90
-
91
-
92
-
93
-
94
-
95
-
96
-
97
-
98
-
99
-
100
-
101
-
102
-
103
-
104
-
105
-
106
-
107
-
108
-
109
-
110
-
111
-
112
-
113
-
114
-
115
-
116
-
117
-
118
-
119
-
120
-
121
-
122
-
123
-
124
-
 125
125 -
 126
126 -
 127
127 -
 128
128 -
 129
129 -
 130
130 -
 131
131 -
 132
132 -
 133
133 -
 134
134 -
 135
135 -
 136
136 -
 137
137 -
 138
138 -
 139
139 -
 140
140 -
 141
141 -
 142
142 -
 143
143 -
 144
144 -
 145
145 -
146
-
147
-
148
-
149
-
150
-
151
-
152
-
153
-
154
-
155
-
156
-
157
-
158
-
159
-
160
-
161
-
162
-
163
-
164
-
165
-
166
-
167
-
168
-
169
-
170
-
171
-
172
-
173
-
174
-
175
-
176
-
177
-
178
-
179
-
180
 |
 |

HONEYWELL INTERNATIONAL INC.
NOTES TO FINANCIAL STATEMENTS—(Continued)
(Dollars in millions, except per share amounts)
investments in real estate funds. Other types of investments include investments in private equity and hedge
funds that follow several different strategies. Our non-U.S. investment policies are different for each country, but
the long-term investment objectives remain the same.
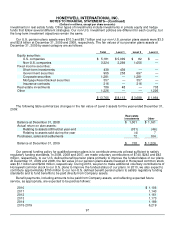
Our U.S. pension plans assets were $10.3 and $8.7 billion and our non-U.S. pension plans assets were $3.5
and $2.8 billion at December 31, 2009 and 2008, respectively. The fair values of our pension plans assets at
December 31, 2009 by asset category are as follows:
Total Level 1 Level 2 Level 3
Equity securities:
U.S. companies $ 5,181 $ 5,099 $ 82 $ —
Non-U.S. companies 3,324 2,269 1,055 —
Fixed income securities:
Short-term investments 439 439 — —
Government securities 955 258 697 —
Corporate securities 1,281 — 1,281 —
Mortgage/Asset-Backed securities 357 — 357 —
Insurance contracts 216 — 216 —
Real estate investments 786 48 — 738
Other 1,226 — — 1,226
$ 13,765 $ 8,113 $ 3,688 $ 1,964
The following table summarizes changes in the fair value of Level 3 assets for the year ended December 31,
2009:
Real estate
investments Other
Balance at December 31, 2008 $ 1,001 $ 1,161
Actual return on plan assets:
Relating to assets still held at year-end (331) (46)
Relating to assets sold during the year (4) 7
Purchases, sales and settlements 72 104
Balance at December 31, 2009 $ 738 $ 1,226
Our general funding policy for qualified pension plans is to contribute amounts at least sufficient to satisfy
regulatory funding standards. In 2009, 2008 and 2007, we made voluntary contributions of $740, $242 and $42
million, respectively, to our U.S. defined benefit pension plans primarily to improve the funded status of our plans.
At December 31, 2009 and 2008, the fair value of our pension plans assets invested in Honeywell common stock
was $1.1 billion and $204 million, respectively. During 2010, we plan to make additional voluntary contributions of
Honeywell common stock to our U.S. plans to improve the funded status of our plans. In 2010, we also expect to
contribute approximately $150 million to our non-U.S. defined benefit pension plans to satisfy regulatory funding
standards and to fund benefits to be paid directly from Company assets.
Benefit payments, including amounts to be paid from Company assets, and reflecting expected future
service, as appropriate, are expected to be paid as follows:
2010 $ 1,106
2011 1,143
2012 1,161
2013 1,173
2014 1,189
2015-2019 6,219
97