Honeywell 2009 Annual Report Download - page 141
Download and view the complete annual report
Please find page 141 of the 2009 Honeywell annual report below. You can navigate through the pages in the report by either clicking on the pages listed below, or by using the keyword search tool below to find specific information within the annual report.-
 1
1 -
2
-
3
-
4
-
5
-
6
-
7
-
8
-
9
-
10
-
11
-
12
-
13
-
14
-
15
-
16
-
17
-
18
-
19
-
20
-
21
-
22
-
23
-
24
-
25
-
26
-
27
-
28
-
29
-
30
-
31
-
32
-
33
-
34
-
35
-
36
-
37
-
38
-
39
-
40
-
41
-
42
-
43
-
44
-
45
-
46
-
47
-
48
-
49
-
50
-
51
-
52
-
53
-
54
-
55
-
56
-
57
-
58
-
59
-
60
-
61
-
62
-
63
-
64
-
65
-
66
-
67
-
68
-
69
-
70
-
71
-
72
-
73
-
74
-
75
-
76
-
77
-
78
-
79
-
80
-
81
-
82
-
83
-
84
-
85
-
86
-
87
-
88
-
89
-
90
-
91
-
92
-
93
-
94
-
95
-
96
-
97
-
98
-
99
-
100
-
101
-
102
-
103
-
104
-
105
-
106
-
107
-
108
-
109
-
110
-
111
-
112
-
113
-
114
-
115
-
116
-
117
-
118
-
119
-
120
-
121
-
122
-
123
-
124
-
125
-
126
-
127
-
128
-
129
-
130
-
 131
131 -
 132
132 -
 133
133 -
 134
134 -
 135
135 -
 136
136 -
 137
137 -
 138
138 -
 139
139 -
 140
140 -
 141
141 -
 142
142 -
 143
143 -
 144
144 -
 145
145 -
 146
146 -
 147
147 -
 148
148 -
 149
149 -
 150
150 -
 151
151 -
152
-
153
-
154
-
155
-
156
-
157
-
158
-
159
-
160
-
161
-
162
-
163
-
164
-
165
-
166
-
167
-
168
-
169
-
170
-
171
-
172
-
173
-
174
-
175
-
176
-
177
-
178
-
179
-
180
 |
 |

HONEYWELL INTERNATIONAL INC.
NOTES TO FINANCIAL STATEMENTS—(Continued)
(Dollars in millions, except per share amounts)
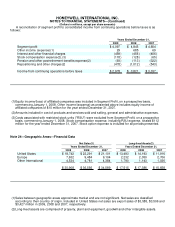
A reconciliation of segment profit to consolidated income from continuing operations before taxes is as
follows:
Years Ended December 31,
2009 2008 2007
Segment profit $ 4,097 $ 4,845 $ 4,654
Other income (expense)(1) 29 685 69
Interest and other financial charges (459) (456) (456)
Stock compensation expense(2),(3) (118) (128) (65)
Pension and other postretirement benefits expense(2) (93) (113) (322)
Repositioning and other charges(2) (478) (1,012) (543)
Income from continuing operations before taxes $ 2,978 $ 3,821 $ 3,337
(1) Equity income/(loss) of affiliated companies was included in Segment Profit, on a prospective basis,
commencing January 1, 2008. Other income/(expense) as presented above includes equity income of
affiliated companies of $10 million for the year ended December 31, 2007.
(2)
Amounts included in cost of products and services sold and selling, general and administrative expenses.
(3)
Costs associated with restricted stock units ("RSU") were excluded from Segment Profit, on a prospective
basis, commencing January 1, 2008. Stock compensation expense, including RSU expense, totaled $112
million for the year ended December 31, 2007. Stock option expense is included for all periods presented.
Note 24—Geographic Areas—Financial Data
Net Sales(1) Long-lived Assets(2)
Years Ended December 31, Years Ended December 31,
2009 2008 2007 2009 2008 2007
United States $ 18,742 $ 22,291 $ 21,101 $ 13,493 $ 14,193 $ 11,916
Europe 7,632 9,484 9,104 2,232 2,050 2,706
Other International 4,534 4,781 4,384 1,790 1,143 1,036
$ 30,908 $ 36,556 $ 34,589 $ 17,515 $ 17,386 $ 15,658
(1) Sales between geographic areas approximate market and are not significant. Net sales are classified
according to their country of origin. Included in United States net sales are export sales of $3,585, $3,506 and
$3,427 million in 2009, 2008 and 2007, respectively.
(2)
Long-lived assets are comprised of property, plant and equipment, goodwill and other intangible assets.