Honeywell 2009 Annual Report Download - page 52
Download and view the complete annual report
Please find page 52 of the 2009 Honeywell annual report below. You can navigate through the pages in the report by either clicking on the pages listed below, or by using the keyword search tool below to find specific information within the annual report.-
 1
1 -
2
-
3
-
4
-
5
-
6
-
7
-
8
-
9
-
10
-
11
-
12
-
13
-
14
-
15
-
16
-
17
-
18
-
19
-
20
-
21
-
22
-
23
-
24
-
25
-
26
-
27
-
28
-
29
-
30
-
31
-
32
-
33
-
34
-
35
-
36
-
37
-
38
-
39
-
40
-
41
-
 42
42 -
 43
43 -
 44
44 -
 45
45 -
 46
46 -
 47
47 -
 48
48 -
 49
49 -
 50
50 -
 51
51 -
 52
52 -
 53
53 -
 54
54 -
 55
55 -
 56
56 -
 57
57 -
 58
58 -
 59
59 -
 60
60 -
 61
61 -
 62
62 -
63
-
64
-
65
-
66
-
67
-
68
-
69
-
70
-
71
-
72
-
73
-
74
-
75
-
76
-
77
-
78
-
79
-
80
-
81
-
82
-
83
-
84
-
85
-
86
-
87
-
88
-
89
-
90
-
91
-
92
-
93
-
94
-
95
-
96
-
97
-
98
-
99
-
100
-
101
-
102
-
103
-
104
-
105
-
106
-
107
-
108
-
109
-
110
-
111
-
112
-
113
-
114
-
115
-
116
-
117
-
118
-
119
-
120
-
121
-
122
-
123
-
124
-
125
-
126
-
127
-
128
-
129
-
130
-
131
-
132
-
133
-
134
-
135
-
136
-
137
-
138
-
139
-
140
-
141
-
142
-
143
-
144
-
145
-
146
-
147
-
148
-
149
-
150
-
151
-
152
-
153
-
154
-
155
-
156
-
157
-
158
-
159
-
160
-
161
-
162
-
163
-
164
-
165
-
166
-
167
-
168
-
169
-
170
-
171
-
172
-
173
-
174
-
175
-
176
-
177
-
178
-
179
-
180
 |
 |

•
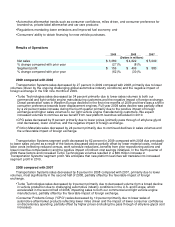
Friction Materials sales were essentially unchanged, primarily due to the favorable impact of foreign
exchange and increased pricing offset by lower original equipment and aftermarket product sales volume.
Transportation Systems segment profit decreased by 30 percent in 2008 compared with 2007 primarily due
to volume declines, as discussed above, material and non-material cost inflation and investments in product
development to support future Turbo platforms. These factors were partially offset by increased productivity and
the favorable impact of foreign exchange.
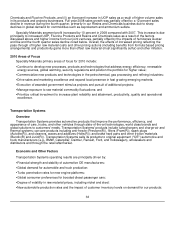
2010 Areas of Focus
Transportation Systems primary areas of focus in 2010 include:
• Sustaining superior turbocharger technology through successful platform launches;
•
Maintaining the high quality of current products while executing new product introductions;
•
Increasing global penetration and share of diesel and gasoline turbocharger OEM demand;
•
Increasing plant productivity to address capacity challenges generated by volatility in product demand and
OEM inventory levels;
•
Aligning cost structure with current economic outlook, and successful execution of repositioning actions;
•
Aligning development efforts and costs with new turbo platform launch schedules; and
•
Continuing global expansion and extension of established strong product brands in CPG.
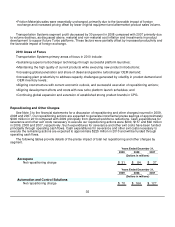
Repositioning and Other Charges
See Note 3 to the financial statements for a discussion of repositioning and other charges incurred in 2009,
2008 and 2007. Our repositioning actions are expected to generate incremental pretax savings of approximately
$300 million in 2010 compared with 2009 principally from planned workforce reductions. Cash expenditures for
severance and other exit costs necessary to execute our repositioning actions were $200, $157 and $92 million
in 2009, 2008 and 2007, respectively. Such expenditures for severance and other exit costs have been funded
principally through operating cash flows. Cash expenditures for severance and other exit costs necessary to
execute the remaining actions are expected to approximate $225 million in 2010 and will be funded through
operating cash flows.
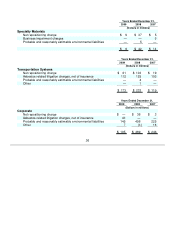
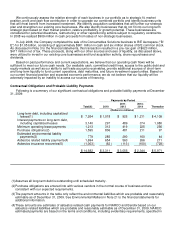
The following tables provide details of the pretax impact of total net repositioning and other charges by
segment.
Years Ended December 31,
2009 2008 2007
(Dollars in millions)
Aerospace
Net repositioning charge $ 31 $ 84 $ 37
Years Ended December 31,
2009 2008 2007
(Dollars in millions)
Automation and Control Solutions
Net repositioning charge $ 70 $ 164 $ 127
35