Honeywell 2009 Annual Report Download - page 107
Download and view the complete annual report
Please find page 107 of the 2009 Honeywell annual report below. You can navigate through the pages in the report by either clicking on the pages listed below, or by using the keyword search tool below to find specific information within the annual report.-
 1
1 -
2
-
3
-
4
-
5
-
6
-
7
-
8
-
9
-
10
-
11
-
12
-
13
-
14
-
15
-
16
-
17
-
18
-
19
-
20
-
21
-
22
-
23
-
24
-
25
-
26
-
27
-
28
-
29
-
30
-
31
-
32
-
33
-
34
-
35
-
36
-
37
-
38
-
39
-
40
-
41
-
42
-
43
-
44
-
45
-
46
-
47
-
48
-
49
-
50
-
51
-
52
-
53
-
54
-
55
-
56
-
57
-
58
-
59
-
60
-
61
-
62
-
63
-
64
-
65
-
66
-
67
-
68
-
69
-
70
-
71
-
72
-
73
-
74
-
75
-
76
-
77
-
78
-
79
-
80
-
81
-
82
-
83
-
84
-
85
-
86
-
87
-
88
-
89
-
90
-
91
-
92
-
93
-
94
-
95
-
96
-
 97
97 -
 98
98 -
 99
99 -
 100
100 -
 101
101 -
 102
102 -
 103
103 -
 104
104 -
 105
105 -
 106
106 -
 107
107 -
 108
108 -
 109
109 -
 110
110 -
 111
111 -
 112
112 -
 113
113 -
 114
114 -
 115
115 -
 116
116 -
 117
117 -
118
-
119
-
120
-
121
-
122
-
123
-
124
-
125
-
126
-
127
-
128
-
129
-
130
-
131
-
132
-
133
-
134
-
135
-
136
-
137
-
138
-
139
-
140
-
141
-
142
-
143
-
144
-
145
-
146
-
147
-
148
-
149
-
150
-
151
-
152
-
153
-
154
-
155
-
156
-
157
-
158
-
159
-
160
-
161
-
162
-
163
-
164
-
165
-
166
-
167
-
168
-
169
-
170
-
171
-
172
-
173
-
174
-
175
-
176
-
177
-
178
-
179
-
180
 |
 |

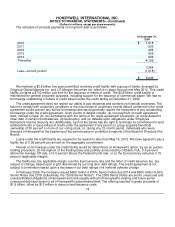
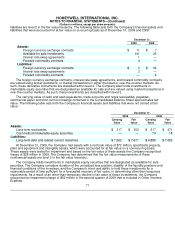
HONEYWELL INTERNATIONAL INC.
NOTES TO FINANCIAL STATEMENTS—(Continued)
(Dollars in millions, except per share amounts)
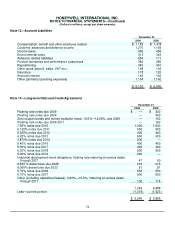
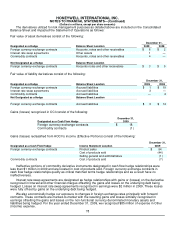
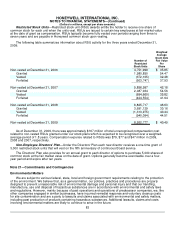
liabilities are level 2 in the fair value hierarchy. The following table sets forth the Company's financial assets and
liabilities that were accounted for at fair value on a recurring basis as of December 31, 2009 and 2008:
December 31,
2009 2008
Assets:
Foreign currency exchange contracts $ 11 $ 7
Available for sale investments 141 23
Interest rate swap agreements 1 —
Forward commodity contracts 4 —
Liabilities:
Foreign currency exchange contracts $ 3 $ 34
Interest rate swap agreements 3 —
Forward commodity contracts — 4
The foreign currency exchange contracts, interest rate swap agreements, and forward commodity contracts
are valued using broker quotations, or market transactions in either the listed or over-the-counter markets. As
such, these derivative instruments are classified within level 2. The Company also holds investments in
marketable equity securities that are designated as available for sale and are valued using market transactions in
over-the-counter markets. As such, these investments are classified within level 2.
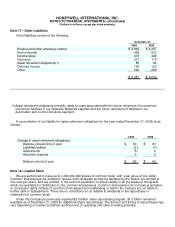
The carrying value of cash and cash equivalents, trade accounts and notes receivables, payables,
commercial paper and short-term borrowings contained in the Consolidated Balance Sheet approximates fair
value. The following table sets forth the Company's financial assets and liabilities that were not carried at fair
value:
December 31,
2009 2008
Carrying
Value Fair
Value Carrying
Value Fair
Value
Assets:
Long-term receivables $ 317 $ 303 $ 517 $ 471
Cost method marketable equity securities — — 74 18
Liabilities:
Long-term debt and related current maturities. $ 7,262 $ 7,677 $ 6,888 $ 7,082
At December 31, 2009, the Company had assets with a net book value of $72 million, specifically property,
plant and equipment and intangible assets, which were accounted for at fair value on a nonrecurring basis.
These assets were tested for impairment and based on the fair value of these assets the Company recognized
losses of $28 million in 2009. The Company has determined that the fair value measurements of these
nonfinancial assets are level 3 in the fair value hierarchy.
The Company holds investments in marketable equity securities that are designated as available for sale
securities. The Company considers duration of the unrealized loss position, stability of the liquidity positions and
financial conditions of the investees, and the Company's intent and ability to hold these investments for a
reasonable period of time sufficient for a forecasted recovery of fair value, in determining other than temporary
impairments. As a result of an other-than-temporary decline in fair value of these investments, the Company
recognized an impairment charge of $62 million in the second quarter of 2009 that is included in Other (Income)
Expense.
77