Honeywell 2009 Annual Report Download - page 91
Download and view the complete annual report
Please find page 91 of the 2009 Honeywell annual report below. You can navigate through the pages in the report by either clicking on the pages listed below, or by using the keyword search tool below to find specific information within the annual report.-
 1
1 -
2
-
3
-
4
-
5
-
6
-
7
-
8
-
9
-
10
-
11
-
12
-
13
-
14
-
15
-
16
-
17
-
18
-
19
-
20
-
21
-
22
-
23
-
24
-
25
-
26
-
27
-
28
-
29
-
30
-
31
-
32
-
33
-
34
-
35
-
36
-
37
-
38
-
39
-
40
-
41
-
42
-
43
-
44
-
45
-
46
-
47
-
48
-
49
-
50
-
51
-
52
-
53
-
54
-
55
-
56
-
57
-
58
-
59
-
60
-
61
-
62
-
63
-
64
-
65
-
66
-
67
-
68
-
69
-
70
-
71
-
72
-
73
-
74
-
75
-
76
-
77
-
78
-
79
-
80
-
 81
81 -
 82
82 -
 83
83 -
 84
84 -
 85
85 -
 86
86 -
 87
87 -
 88
88 -
 89
89 -
 90
90 -
 91
91 -
 92
92 -
 93
93 -
 94
94 -
 95
95 -
 96
96 -
 97
97 -
 98
98 -
 99
99 -
 100
100 -
 101
101 -
102
-
103
-
104
-
105
-
106
-
107
-
108
-
109
-
110
-
111
-
112
-
113
-
114
-
115
-
116
-
117
-
118
-
119
-
120
-
121
-
122
-
123
-
124
-
125
-
126
-
127
-
128
-
129
-
130
-
131
-
132
-
133
-
134
-
135
-
136
-
137
-
138
-
139
-
140
-
141
-
142
-
143
-
144
-
145
-
146
-
147
-
148
-
149
-
150
-
151
-
152
-
153
-
154
-
155
-
156
-
157
-
158
-
159
-
160
-
161
-
162
-
163
-
164
-
165
-
166
-
167
-
168
-
169
-
170
-
171
-
172
-
173
-
174
-
175
-
176
-
177
-
178
-
179
-
180
 |
 |

HONEYWELL INTERNATIONAL INC.
NOTES TO FINANCIAL STATEMENTS—(Continued)
(Dollars in millions, except per share amounts)
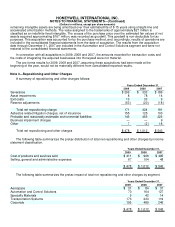
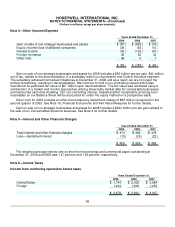
Note 4—Other (Income)/Expense
Years Ended December 31,
2009 2008 2007
Gain on sale of non-strategic businesses and assets $ (87) $ (635) $ (19)
Equity (income)/loss of affiliated companies (26) (63) (10)
Interest income (33 ) (102) (81)
Foreign exchange 45 52 34
Other (net) 46 0 7
$ (55) $ (748) $ (69)
Gain on sale of non-strategic businesses and assets for 2009 includes a $50 million pre-tax gain, $42 million
net of tax, related to the deconsolidation of a subsidiary within our Automation and Control Solutions segment.
The subsidiary achieved contractual milestones at December 31, 2009 and as a result, we are no longer the
primary beneficiary, resulting in deconsolidation. We continue to hold a non-controlling interest which was
recorded at its estimated fair value of $67 million upon deconsolidation. The fair value was estimated using a
combination of a market and income approaches utilizing observable market data for comparable businesses
and discounted cash flow modeling. Our non-controlling interest, classified within Investments and long-term
receivables on our Balance Sheet will be accounted for under the equity method on a prospective basis.
Other (net) for 2009 includes an other-than-temporary impairment charge of $62 million recognized in the
second quarter of 2009. See Note 16, Financial Instruments and Fair Value Measures for further details.
Gain on sale of non-strategic businesses and assets for 2008 includes a $623 million pre-tax gain related to
the sale of our Consumables Solutions business. See Note 2 for further details.
Note 5—Interest and Other Financial Charges
Years Ended December 31,
2009 2008 2007
Total interest and other financial charges $ 474 $ 482 $ 478
Less—capitalized interest (15) (26) (22)
$ 459 $ 456 $ 456
The weighted average interest rate on short-term borrowings and commercial paper outstanding at
December 31, 2009 and 2008 was 1.47 percent and 1.63 percent, respectively.
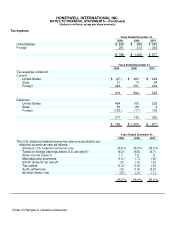
Note 6—Income Taxes
Income from continuing operations before taxes
Years Ended December 31,
2009 2008 2007
United States $ 1,744 $ 2,003 $ 2,084
Foreign 1,234 1,818 1,253
$ 2,978 $ 3,821 $ 3,337
66