Honeywell 2009 Annual Report Download - page 97
Download and view the complete annual report
Please find page 97 of the 2009 Honeywell annual report below. You can navigate through the pages in the report by either clicking on the pages listed below, or by using the keyword search tool below to find specific information within the annual report.-
 1
1 -
2
-
3
-
4
-
5
-
6
-
7
-
8
-
9
-
10
-
11
-
12
-
13
-
14
-
15
-
16
-
17
-
18
-
19
-
20
-
21
-
22
-
23
-
24
-
25
-
26
-
27
-
28
-
29
-
30
-
31
-
32
-
33
-
34
-
35
-
36
-
37
-
38
-
39
-
40
-
41
-
42
-
43
-
44
-
45
-
46
-
47
-
48
-
49
-
50
-
51
-
52
-
53
-
54
-
55
-
56
-
57
-
58
-
59
-
60
-
61
-
62
-
63
-
64
-
65
-
66
-
67
-
68
-
69
-
70
-
71
-
72
-
73
-
74
-
75
-
76
-
77
-
78
-
79
-
80
-
81
-
82
-
83
-
84
-
85
-
86
-
 87
87 -
 88
88 -
 89
89 -
 90
90 -
 91
91 -
 92
92 -
 93
93 -
 94
94 -
 95
95 -
 96
96 -
 97
97 -
 98
98 -
 99
99 -
 100
100 -
 101
101 -
 102
102 -
 103
103 -
 104
104 -
 105
105 -
 106
106 -
 107
107 -
108
-
109
-
110
-
111
-
112
-
113
-
114
-
115
-
116
-
117
-
118
-
119
-
120
-
121
-
122
-
123
-
124
-
125
-
126
-
127
-
128
-
129
-
130
-
131
-
132
-
133
-
134
-
135
-
136
-
137
-
138
-
139
-
140
-
141
-
142
-
143
-
144
-
145
-
146
-
147
-
148
-
149
-
150
-
151
-
152
-
153
-
154
-
155
-
156
-
157
-
158
-
159
-
160
-
161
-
162
-
163
-
164
-
165
-
166
-
167
-
168
-
169
-
170
-
171
-
172
-
173
-
174
-
175
-
176
-
177
-
178
-
179
-
180
 |
 |

HONEYWELL INTERNATIONAL INC.
NOTES TO FINANCIAL STATEMENTS—(Continued)
(Dollars in millions, except per share amounts)
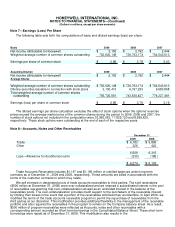
Note 7—Earnings (Loss) Per Share
The following table sets forth the computations of basic and diluted earnings (loss) per share:
Basic 2009 2008 2007
Net income attributable to Honeywell $ 2,153 $ 2,792 $ 2,444
Weighted average number of common shares outstanding 752,620,148 736,763,174 764,543,613
Earnings per share of common stock $ 2.86 $ 3.79 $ 3.20
Assuming Dilution 2009 2008 2007
Net income attributable to Honeywell $ 2,153 $ 2,792 $ 2,444
Average Shares
Weighted average number of common shares outstanding $ 752,620,148 $ 736,763,174 $ 764,543,613
Dilutive securities issuable in connection with stock plans 3,100,413 6,767,253 9,683,868
Total weighted average number of common shares
outstanding 755,720,561 743,530,427 774,227,481
Earnings (loss) per share of common stock $ 2.85 $ 3.76 $ 3.16
The diluted earnings per share calculation excludes the effect of stock options when the options' exercise
prices exceed the average market price of the common shares during the period. In 2009, 2008 and 2007, the
number of stock options not included in the computation were 33,962,053, 17,825,720 and 8,599,620,
respectively. These stock options were outstanding at the end of each of the respective years.
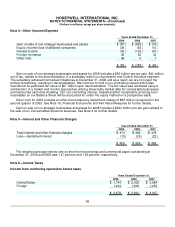
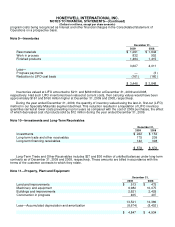
Note 8—Accounts, Notes and Other Receivables
December 31,
2009 2008
Trade $ 6,183 $ 5,893
Other 326 422
6,509 6,315
Less—Allowance for doubtful accounts (235) (186)
$ 6,274 $ 6,129
Trade Accounts Receivable includes $1,167 and $1,195 million of unbilled balances under long-term
contracts as of December 31, 2009 and 2008, respectively. These amounts are billed in accordance with the
terms of the customer contracts to which they relate.
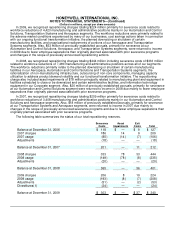
We sell interests in designated pools of trade accounts receivables to third parties. The sold receivables
($500 million at December 31, 2008) were over-collateralized and we retained a subordinated interest in the pool
of receivables representing that over-collateralization as well as an undivided interest in the balance of the
receivables pools. The over-collateralization provides credit support to the purchasers of the receivable interest
by limiting their losses in the event that a portion of the receivables sold becomes uncollectible. In April 2009, we
modified the terms of the trade accounts receivable program to permit the repurchase of receivables from the
third parties at our discretion. This modification provides additional flexibility in the management of the receivable
portfolio and also requires the receivables in the program to remain on the Company balance sheet. As a result,
$500 million of program receivables were reflected as Accounts, notes and other receivables with a
corresponding amount recorded as Short-term borrowings in the Consolidated Balance Sheet. These short-term
borrowings were repaid as of December 31, 2009. This modification also results in the