Honeywell 2009 Annual Report Download - page 57
Download and view the complete annual report
Please find page 57 of the 2009 Honeywell annual report below. You can navigate through the pages in the report by either clicking on the pages listed below, or by using the keyword search tool below to find specific information within the annual report.-
 1
1 -
2
-
3
-
4
-
5
-
6
-
7
-
8
-
9
-
10
-
11
-
12
-
13
-
14
-
15
-
16
-
17
-
18
-
19
-
20
-
21
-
22
-
23
-
24
-
25
-
26
-
27
-
28
-
29
-
30
-
31
-
32
-
33
-
34
-
35
-
36
-
37
-
38
-
39
-
40
-
41
-
42
-
43
-
44
-
45
-
46
-
 47
47 -
 48
48 -
 49
49 -
 50
50 -
 51
51 -
 52
52 -
 53
53 -
 54
54 -
 55
55 -
 56
56 -
 57
57 -
 58
58 -
 59
59 -
 60
60 -
 61
61 -
 62
62 -
 63
63 -
 64
64 -
 65
65 -
 66
66 -
 67
67 -
68
-
69
-
70
-
71
-
72
-
73
-
74
-
75
-
76
-
77
-
78
-
79
-
80
-
81
-
82
-
83
-
84
-
85
-
86
-
87
-
88
-
89
-
90
-
91
-
92
-
93
-
94
-
95
-
96
-
97
-
98
-
99
-
100
-
101
-
102
-
103
-
104
-
105
-
106
-
107
-
108
-
109
-
110
-
111
-
112
-
113
-
114
-
115
-
116
-
117
-
118
-
119
-
120
-
121
-
122
-
123
-
124
-
125
-
126
-
127
-
128
-
129
-
130
-
131
-
132
-
133
-
134
-
135
-
136
-
137
-
138
-
139
-
140
-
141
-
142
-
143
-
144
-
145
-
146
-
147
-
148
-
149
-
150
-
151
-
152
-
153
-
154
-
155
-
156
-
157
-
158
-
159
-
160
-
161
-
162
-
163
-
164
-
165
-
166
-
167
-
168
-
169
-
170
-
171
-
172
-
173
-
174
-
175
-
176
-
177
-
178
-
179
-
180
 |
 |
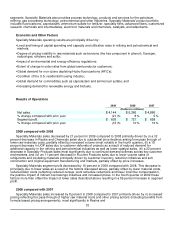
We continuously assess the relative strength of each business in our portfolio as to strategic fit, market
position, profit and cash flow contribution in order to upgrade our combined portfolio and identify business units
that will most benefit from increased investment. We identify acquisition candidates that will further our strategic
plan and strengthen our existing core businesses. We also identify businesses that do not fit into our long-term
strategic plan based on their market position, relative profitability or growth potential. These businesses are
considered for potential divestiture, restructuring or other repositioning actions subject to regulatory constraints.
In 2008 we realized $909 million in cash proceeds from sales of non-strategic businesses.
In July 2008, the Company completed the sale of its Consumables Solutions business to B/E Aerospace ("B/
E") for $1.05 billion, consisting of approximately $901 million in cash and six million shares of B/E common stock.
As discussed in Note 3 to the financial statements, this transaction resulted in a pre- tax gain of $623 million,
$417 million net of tax. These proceeds, along with our other sources and uses of liquidity, as discussed above,
were utilized to invest in our existing core businesses and fund acquisition activity, share repurchases and
dividends.
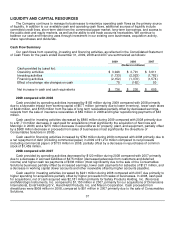
Based on past performance and current expectations, we believe that our operating cash flows will be
sufficient to meet our future cash needs. Our available cash, committed credit lines, access to the public debt and
equity markets as well as our ability to sell trade accounts receivables, provide additional sources of short-term
and long-term liquidity to fund current operations, debt maturities, and future investment opportunities. Based on
our current financial position and expected economic performance, we do not believe that our liquidity will be
adversely impacted by an inability to access our sources of financing.
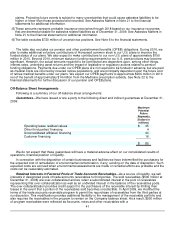
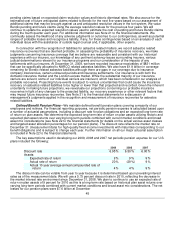
Contractual Obligations and Probable Liability Payments
Following is a summary of our significant contractual obligations and probable liability payments at December
31, 2009:
Total(6)
Payments by Period
Thereafter
2010 2011-
2012 2013-
2014
(Dollars in millions)
Long-term debt, including capitalized
leases(1) $ 7,264 $ 1,018 $ 926 $ 1,211 $ 4,109
Interest payments on long-term debt,
including capitalized leases 3,140 297 489 374 1,980
Minimum operating lease payments 1,213 313 419 225 256
Purchase obligations(2) 1,595 806 481 211 97
Estimated environmental liability
payments(3) 779 285 290 160 44
Asbestos related liability payments(4) 1,694 654 563 266 211
Asbestos insurance recoveries(5) (1,003) (62) (113) (100) (728)
$ 14,682 $ 3,311 $ 3,056 $ 2,344 $ 5,971
(1) Assumes all long-term debt is outstanding until scheduled maturity.
(2)
Purchase obligations are entered into with various vendors in the normal course of business and are
consistent with our expected requirements.
(3)
The payment amounts in the table only reflect the environmental liabilities which are probable and reasonably
estimable as of December 31, 2009. See Environmental Matters in Note 21 to the financial statements for
additional information.
(4)
These amounts are estimates of asbestos related cash payments for NARCO and Bendix based on our
asbestos related liabilities which are probable and reasonably estimable as of December 31, 2009. NARCO
estimated payments are based on the terms and conditions, including evidentiary requirements, specified in