Honeywell 2009 Annual Report Download - page 49
Download and view the complete annual report
Please find page 49 of the 2009 Honeywell annual report below. You can navigate through the pages in the report by either clicking on the pages listed below, or by using the keyword search tool below to find specific information within the annual report.-
 1
1 -
2
-
3
-
4
-
5
-
6
-
7
-
8
-
9
-
10
-
11
-
12
-
13
-
14
-
15
-
16
-
17
-
18
-
19
-
20
-
21
-
22
-
23
-
24
-
25
-
26
-
27
-
28
-
29
-
30
-
31
-
32
-
33
-
34
-
35
-
36
-
37
-
38
-
 39
39 -
 40
40 -
 41
41 -
 42
42 -
 43
43 -
 44
44 -
 45
45 -
 46
46 -
 47
47 -
 48
48 -
 49
49 -
 50
50 -
 51
51 -
 52
52 -
 53
53 -
 54
54 -
 55
55 -
 56
56 -
 57
57 -
 58
58 -
 59
59 -
60
-
61
-
62
-
63
-
64
-
65
-
66
-
67
-
68
-
69
-
70
-
71
-
72
-
73
-
74
-
75
-
76
-
77
-
78
-
79
-
80
-
81
-
82
-
83
-
84
-
85
-
86
-
87
-
88
-
89
-
90
-
91
-
92
-
93
-
94
-
95
-
96
-
97
-
98
-
99
-
100
-
101
-
102
-
103
-
104
-
105
-
106
-
107
-
108
-
109
-
110
-
111
-
112
-
113
-
114
-
115
-
116
-
117
-
118
-
119
-
120
-
121
-
122
-
123
-
124
-
125
-
126
-
127
-
128
-
129
-
130
-
131
-
132
-
133
-
134
-
135
-
136
-
137
-
138
-
139
-
140
-
141
-
142
-
143
-
144
-
145
-
146
-
147
-
148
-
149
-
150
-
151
-
152
-
153
-
154
-
155
-
156
-
157
-
158
-
159
-
160
-
161
-
162
-
163
-
164
-
165
-
166
-
167
-
168
-
169
-
170
-
171
-
172
-
173
-
174
-
175
-
176
-
177
-
178
-
179
-
180
 |
 |

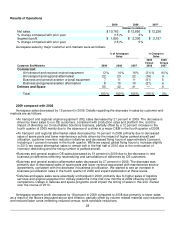
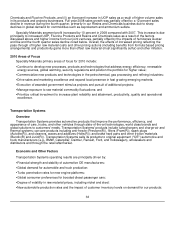
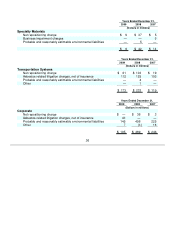
Chemicals and Fluorine Products, and (ii) an 8 percent increase in UOP sales as a result of higher volume sales
in its products and projects businesses. Full year 2008 sales growth was partially offset by a 12 percent sales
decline in revenue during the fourth quarter, primarily in our Resins and Chemicals business due to sharp
declines in global demand for commodities such as caprolactam and ammonium sulfate.
Specialty Materials segment profit increased by 10 percent in 2008 compared with 2007. This increase is due
principally to increased UOP, Fluorine Products and Resins and Chemicals sales as a result of the factors
discussed above and higher income from our joint ventures, partially offset by the impacts of hurricanes Gustav
and Ike and the fourth quarter sales decline noted below. Overall, the effects of increased pricing reflecting the
pass-through of higher raw material costs and other pricing actions (including benefits from formula based pricing
arrangements) and productivity gains more than offset raw material (most significantly sulfur) and other inflation.
2010 Areas of Focus
Specialty Materials primary areas of focus for 2010 include:
• Continue to develop new processes, products and technologies that address energy efficiency, renewable
energy sources, global warming, security regulations and position the portfolio for higher value;
•
Commercialize new products and technologies in the petrochemical, gas processing and refining industries;
•
Drive sales and marketing excellence and expand local presence in fast growing emerging markets;
•
Execution of awarded government stimulus projects and pursuit of additional projects;
•
Manage exposure to raw material commodity fluctuations; and
•
Prioritize critical investment to increase plant reliability and attainment, productivity, quality and operational
excellence.
Transportation Systems
Overview
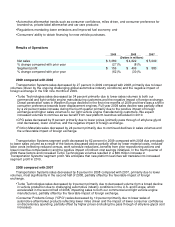
Transportation Systems provides automotive products that improve the performance, efficiency, and
appearance of cars, trucks, and other vehicles through state-of-the-art technologies, world class brands and
global solutions to customers' needs. Transportation Systems' products include turbochargers and charge-air and
thermal systems; car care products including anti-freeze (Prestone(R)), filters (Fram(R)), spark plugs
(Autolite(R)), and cleaners, waxes and additives (Holts(R)); and brake hard parts and other friction materials
(Bendix(R) and Jurid(R)). Transportation Systems sells its products to original equipment ("OE") automotive and
truck manufacturers (e.g., BMW, Caterpillar, Daimler, Renault, Ford, and Volkswagen), wholesalers and
distributors and through the retail aftermarket.
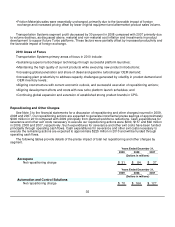
Economic and Other Factors
Transportation Systems operating results are principally driven by:
• Financial strength and stability of automotive OE manufacturers;
•
Global demand for automobile and truck production;
•
Turbo penetration rates for new engine platforms;
•
Global consumer preferences for boosted diesel passenger cars;
•
Degree of volatility in raw material prices, including nickel and steel;
•
New automobile production rates and the impact of customer inventory levels on demand for our products;
33