Honeywell 2009 Annual Report Download - page 73
Download and view the complete annual report
Please find page 73 of the 2009 Honeywell annual report below. You can navigate through the pages in the report by either clicking on the pages listed below, or by using the keyword search tool below to find specific information within the annual report.-
 1
1 -
2
-
3
-
4
-
5
-
6
-
7
-
8
-
9
-
10
-
11
-
12
-
13
-
14
-
15
-
16
-
17
-
18
-
19
-
20
-
21
-
22
-
23
-
24
-
25
-
26
-
27
-
28
-
29
-
30
-
31
-
32
-
33
-
34
-
35
-
36
-
37
-
38
-
39
-
40
-
41
-
42
-
43
-
44
-
45
-
46
-
47
-
48
-
49
-
50
-
51
-
52
-
53
-
54
-
55
-
56
-
57
-
58
-
59
-
60
-
61
-
62
-
 63
63 -
 64
64 -
 65
65 -
 66
66 -
 67
67 -
 68
68 -
 69
69 -
 70
70 -
 71
71 -
 72
72 -
 73
73 -
 74
74 -
 75
75 -
 76
76 -
 77
77 -
 78
78 -
 79
79 -
 80
80 -
 81
81 -
 82
82 -
 83
83 -
84
-
85
-
86
-
87
-
88
-
89
-
90
-
91
-
92
-
93
-
94
-
95
-
96
-
97
-
98
-
99
-
100
-
101
-
102
-
103
-
104
-
105
-
106
-
107
-
108
-
109
-
110
-
111
-
112
-
113
-
114
-
115
-
116
-
117
-
118
-
119
-
120
-
121
-
122
-
123
-
124
-
125
-
126
-
127
-
128
-
129
-
130
-
131
-
132
-
133
-
134
-
135
-
136
-
137
-
138
-
139
-
140
-
141
-
142
-
143
-
144
-
145
-
146
-
147
-
148
-
149
-
150
-
151
-
152
-
153
-
154
-
155
-
156
-
157
-
158
-
159
-
160
-
161
-
162
-
163
-
164
-
165
-
166
-
167
-
168
-
169
-
170
-
171
-
172
-
173
-
174
-
175
-
176
-
177
-
178
-
179
-
180
 |
 |

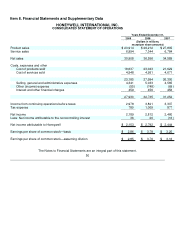
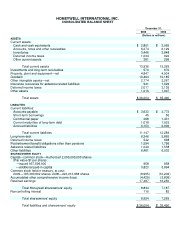
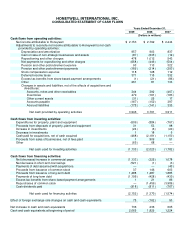
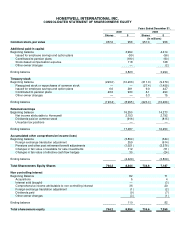
HONEYWELL INTERNATIONAL INC.
CONSOLIDATED STATEMENT OF CASH FLOWS
Years Ended December 31,
2009 2008 2007
(Dollars in millions)
Cash flows from operating activities:
Net income attributable to Honeywell $ 2,153 $ 2,792 $ 2,444
Adjustments to reconcile net income attributable to Honeywell to net cash
provided by operating activities:
Depreciation and amortization 957 903 837
Gain on sale of non-strategic businesses and assets (87) (635) (19)
Repositioning and other charges 478 1,012 543
Net payments for repositioning and other charges (658) (446) (504)
Pension and other postretirement expense 93 113 322
Pension and other postretirement payments (189) (214) (300)
Stock compensation expense 118 128 112
Deferred income taxes 371 115 332
Excess tax benefits from share based payment arrangements (1) (21) (86)
Other 261 81 133
Changes in assets and liabilities, net of the effects of acquisitions and
divestitures:
Accounts, notes and other receivables 344 392 (467)
Inventories 479 (161) (183)
Other current assets (31) 25 17
Accounts payable (167) (152) 397
Accrued liabilities (175) (141) 333
Net cash provided by operating activities 3,946 3,791 3,911
Cash flows from investing activities:
Expenditures for property, plant and equipment (609) (884) (767)
Proceeds from disposals of property, plant and equipment 31 53 98
Increase in investments (24) (6) (20)
Decrease in investments 1 18 6
Cash paid for acquisitions, net of cash acquired (468) (2,181) (1,150)
Proceeds from sales of businesses, net of fees paid 1 909 51
Other (65) 68 —
Net cash used for investing activities (1,133) (2,023) (1,782)
Cash flows from financing activities:
Net (decrease)/increase in commercial paper (1,133) (325) 1,078
Net decrease in short-term borrowings (521) (1) (3)
Payments of debt assumed with acquisitions — — (40)
Proceeds from issuance of common stock 37 146 603
Proceeds from issuance of long-term debt 1,488 1,487 1,885
Payments of long-term debt (1,106) (428) (430)
Excess tax benefits from share based payment arrangements 1 21 86
Repurchases of common stock — (1,459) (3,986)
Cash dividends paid (918) (811) (767)
Net cash used for financing activities (2,152) (1,370) (1,574)
Effect of foreign exchange rate changes on cash and cash equivalents 75 (162) 50
Net increase in cash and cash equivalents 736 236 605
Cash and cash equivalents at beginning of period 2,065 1,829 1,224