Honeywell 2009 Annual Report Download - page 143
Download and view the complete annual report
Please find page 143 of the 2009 Honeywell annual report below. You can navigate through the pages in the report by either clicking on the pages listed below, or by using the keyword search tool below to find specific information within the annual report.-
 1
1 -
2
-
3
-
4
-
5
-
6
-
7
-
8
-
9
-
10
-
11
-
12
-
13
-
14
-
15
-
16
-
17
-
18
-
19
-
20
-
21
-
22
-
23
-
24
-
25
-
26
-
27
-
28
-
29
-
30
-
31
-
32
-
33
-
34
-
35
-
36
-
37
-
38
-
39
-
40
-
41
-
42
-
43
-
44
-
45
-
46
-
47
-
48
-
49
-
50
-
51
-
52
-
53
-
54
-
55
-
56
-
57
-
58
-
59
-
60
-
61
-
62
-
63
-
64
-
65
-
66
-
67
-
68
-
69
-
70
-
71
-
72
-
73
-
74
-
75
-
76
-
77
-
78
-
79
-
80
-
81
-
82
-
83
-
84
-
85
-
86
-
87
-
88
-
89
-
90
-
91
-
92
-
93
-
94
-
95
-
96
-
97
-
98
-
99
-
100
-
101
-
102
-
103
-
104
-
105
-
106
-
107
-
108
-
109
-
110
-
111
-
112
-
113
-
114
-
115
-
116
-
117
-
118
-
119
-
120
-
121
-
122
-
123
-
124
-
125
-
126
-
127
-
128
-
129
-
130
-
131
-
132
-
 133
133 -
 134
134 -
 135
135 -
 136
136 -
 137
137 -
 138
138 -
 139
139 -
 140
140 -
 141
141 -
 142
142 -
 143
143 -
 144
144 -
 145
145 -
 146
146 -
 147
147 -
 148
148 -
 149
149 -
 150
150 -
 151
151 -
 152
152 -
 153
153 -
154
-
155
-
156
-
157
-
158
-
159
-
160
-
161
-
162
-
163
-
164
-
165
-
166
-
167
-
168
-
169
-
170
-
171
-
172
-
173
-
174
-
175
-
176
-
177
-
178
-
179
-
180
 |
 |

HONEYWELL INTERNATIONAL INC.
NOTES TO FINANCIAL STATEMENTS—(Continued)
(Dollars in millions, except per share amounts)
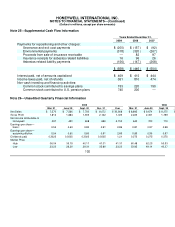
Note 25—Supplemental Cash Flow Information
Years Ended December 31,
2009 2008 2007
Payments for repositioning and other charges:
Severance and exit cost payments $ (200) $ (157) $ (92)
Environmental payments (318) (320) (267)
Proceeds from sale of insurance receivable — 82 97
Insurance receipts for asbestos related liabilities 16 96 26
Asbestos related liability payments (156) (147) (268)
$ (658) $ (446) $ (504)
Interest paid, net of amounts capitalized $ 469 $ 415 $ 444
Income taxes paid, net of refunds 361 810 474
Non-cash investing and financing activities:
Common stock contributed to savings plans 153 220 199
Common stock contributed to U.S. pension plans 740 200 —
Note 26—Unaudited Quarterly Financial Information
2009 2008
Mar. 31 June 30 Sept. 30 Dec. 31 Year Mar. 31 June 30 Sept. 30 Dec. 31
Net Sales $ 7,570 $ 7,566 $ 7,700 $ 8,072 $ 30,908 $ 8,895 $ 9,674 $ 9,275 $
Gross Profit 1,814 1,884 1,903 2,122 7,723 2,223 2,351 1,799
Net income attributable to
Honeywell 397 450 608 698 2,153 643 723 719
Earnings per share—
basic: 0.54 0.60 0.80 0.91 2.86 0.87 0.97 0.98
Earnings per share—
assuming dilution: 0.54 0.60 0.80 0.91 2.85 0.85 0.96 0.97
Dividends paid 0.3025 0.3025 0.3025 0.3025 1.21 0.275 0.275 0.275
Market Price
High 36.04 35.79 40.17 41.31 41.31 60.48 62.25 50.93
Low 23.23 29.29 29.31 35.89 23.23 53.95 49.14 40.37
102