Honeywell 2009 Annual Report Download - page 50
Download and view the complete annual report
Please find page 50 of the 2009 Honeywell annual report below. You can navigate through the pages in the report by either clicking on the pages listed below, or by using the keyword search tool below to find specific information within the annual report.-
 1
1 -
2
-
3
-
4
-
5
-
6
-
7
-
8
-
9
-
10
-
11
-
12
-
13
-
14
-
15
-
16
-
17
-
18
-
19
-
20
-
21
-
22
-
23
-
24
-
25
-
26
-
27
-
28
-
29
-
30
-
31
-
32
-
33
-
34
-
35
-
36
-
37
-
38
-
39
-
 40
40 -
 41
41 -
 42
42 -
 43
43 -
 44
44 -
 45
45 -
 46
46 -
 47
47 -
 48
48 -
 49
49 -
 50
50 -
 51
51 -
 52
52 -
 53
53 -
 54
54 -
 55
55 -
 56
56 -
 57
57 -
 58
58 -
 59
59 -
 60
60 -
61
-
62
-
63
-
64
-
65
-
66
-
67
-
68
-
69
-
70
-
71
-
72
-
73
-
74
-
75
-
76
-
77
-
78
-
79
-
80
-
81
-
82
-
83
-
84
-
85
-
86
-
87
-
88
-
89
-
90
-
91
-
92
-
93
-
94
-
95
-
96
-
97
-
98
-
99
-
100
-
101
-
102
-
103
-
104
-
105
-
106
-
107
-
108
-
109
-
110
-
111
-
112
-
113
-
114
-
115
-
116
-
117
-
118
-
119
-
120
-
121
-
122
-
123
-
124
-
125
-
126
-
127
-
128
-
129
-
130
-
131
-
132
-
133
-
134
-
135
-
136
-
137
-
138
-
139
-
140
-
141
-
142
-
143
-
144
-
145
-
146
-
147
-
148
-
149
-
150
-
151
-
152
-
153
-
154
-
155
-
156
-
157
-
158
-
159
-
160
-
161
-
162
-
163
-
164
-
165
-
166
-
167
-
168
-
169
-
170
-
171
-
172
-
173
-
174
-
175
-
176
-
177
-
178
-
179
-
180
 |
 |

•
Automotive aftermarket trends such as consumer confidence, miles driven, and consumer preference for
branded vs. private label aftermarket and car care products;
•
Regulations mandating lower emissions and improved fuel economy; and
•
Consumers' ability to obtain financing for new vehicle purchases.
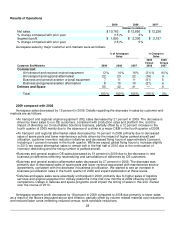
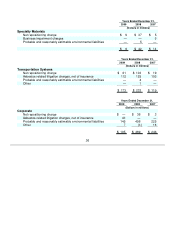
Results of Operations
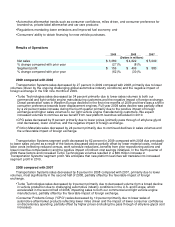
2009 2008 2007
(Dollars in millions)
Net sales $ 3,389 $ 4,622 $ 5,009
% change compared with prior year (27)% (8)%
Segment profit $ 156 $ 406 $ 583
% change compared with prior year (62)% (30)%
2009 compared with 2008
Transportation Systems sales decreased by 27 percent in 2009 compared with 2008, primarily due to lower
volumes (driven by the ongoing challenging global automotive industry conditions) and the negative impact of
foreign exchange in the first nine months of 2009.
• Turbo Technologies sales decreased by 34 percent primarily due to lower sales volumes to both our
commercial and light vehicle engine manufacturing customers and the negative impact of foreign exchange.
Diesel penetration rates in Western Europe declined in the first nine months of 2009 and there was a shift in
consumer preference towards lower displacement engines. Full year 2009 sales decline was partially offset
by a 22 percent sales increase during the fourth quarter primarily due to the positive impact of foreign
exchange and higher sales volumes to our light vehicle engine manufacturing customers. We expect
increased volumes to continue as we benefit from new platform launches scheduled in 2010.
•
CPG sales decreased by 8 percent primarily due to lower prices (primarily pass through of ethylene glycol
cost decreases), lower volumes, and the negative impact of foreign exchange.
•
Friction Materials sales decreased by 24 percent primarily due to continued declines in sales volumes and
the unfavorable impact of foreign exchange.
Transportation Systems segment profit decreased by 62 percent in 2009 compared with 2008 due principally
to lower sales volume as a result of the factors discussed above partially offset by lower material costs, reduced
labor costs (reflecting reduced census, work schedule reductions, benefits from prior repositioning actions and
lower incentive compensation) and the positive impact of indirect cost savings initiatives. In the fourth quarter of
2009 these factors and increased Turbo Technologies volumes resulted in a $66 million increase in
Transportation Systems' segment profit. We anticipate that new platform launches will translate into increased
segment profit in 2010.
2008 compared with 2007
Transportation Systems sales decreased by 8 percent in 2008 compared with 2007, primarily due to lower
volumes, most significantly in the second half of 2008, partially offset by the favorable impact of foreign
exchange.
• Turbo Technologies sales decreased by 9 percent primarily due to decreased volume from a broad decline
in vehicle production due to challenging automotive industry conditions in the U.S. and Europe, which
accelerated in the second half of 2008, impacting sales to both our commercial and light vehicle engine
manufacturers, partially offset by the favorable impact of foreign exchange.
•
Consumer Products Group ("CPG") sales decreased by 10 percent primarily due to lower sales of
automotive aftermarket products reflecting lower miles driven and the impact of lower consumer confidence
on discretionary spending, partially offset by higher prices (including the pass through of ethylene glycol cost
increases).