Honeywell 2009 Annual Report Download - page 47
Download and view the complete annual report
Please find page 47 of the 2009 Honeywell annual report below. You can navigate through the pages in the report by either clicking on the pages listed below, or by using the keyword search tool below to find specific information within the annual report.-
 1
1 -
2
-
3
-
4
-
5
-
6
-
7
-
8
-
9
-
10
-
11
-
12
-
13
-
14
-
15
-
16
-
17
-
18
-
19
-
20
-
21
-
22
-
23
-
24
-
25
-
26
-
27
-
28
-
29
-
30
-
31
-
32
-
33
-
34
-
35
-
36
-
 37
37 -
 38
38 -
 39
39 -
 40
40 -
 41
41 -
 42
42 -
 43
43 -
 44
44 -
 45
45 -
 46
46 -
 47
47 -
 48
48 -
 49
49 -
 50
50 -
 51
51 -
 52
52 -
 53
53 -
 54
54 -
 55
55 -
 56
56 -
 57
57 -
58
-
59
-
60
-
61
-
62
-
63
-
64
-
65
-
66
-
67
-
68
-
69
-
70
-
71
-
72
-
73
-
74
-
75
-
76
-
77
-
78
-
79
-
80
-
81
-
82
-
83
-
84
-
85
-
86
-
87
-
88
-
89
-
90
-
91
-
92
-
93
-
94
-
95
-
96
-
97
-
98
-
99
-
100
-
101
-
102
-
103
-
104
-
105
-
106
-
107
-
108
-
109
-
110
-
111
-
112
-
113
-
114
-
115
-
116
-
117
-
118
-
119
-
120
-
121
-
122
-
123
-
124
-
125
-
126
-
127
-
128
-
129
-
130
-
131
-
132
-
133
-
134
-
135
-
136
-
137
-
138
-
139
-
140
-
141
-
142
-
143
-
144
-
145
-
146
-
147
-
148
-
149
-
150
-
151
-
152
-
153
-
154
-
155
-
156
-
157
-
158
-
159
-
160
-
161
-
162
-
163
-
164
-
165
-
166
-
167
-
168
-
169
-
170
-
171
-
172
-
173
-
174
-
175
-
176
-
177
-
178
-
179
-
180
 |
 |

segments. Specialty Materials also provides process technology, products and services for the petroleum
refining, gas processing technology, petrochemical and other industries. Specialty Materials' product portfolio
includes fluorocarbons, caprolactam, ammonium sulfate for fertilizer, specialty films, advanced fibers, customized
research chemicals and intermediates, electronic materials and chemicals, catalysts, and adsorbents.
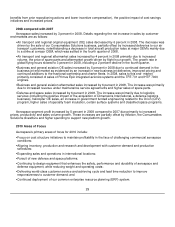
Economic and Other Factors
Specialty Materials operating results are principally driven by:
• Level and timing of capital spending and capacity and utilization rates in refining and petrochemical end
markets;
•
Degree of pricing volatility in raw materials such as benzene (the key component in phenol), fluorspar,
natural gas, ethylene and sulfur;
•
Impact of environmental and energy efficiency regulations;
•
Extent of change in order rates from global semiconductor customers;
•
Global demand for non-ozone depleting Hydro fluorocarbons (HFC's);
•
Condition of the U.S. residential housing industry;
•
Global demand for commodities such as caprolactam and ammonium sulfate; and
•
Increasing demand for renewable energy and biofuels.
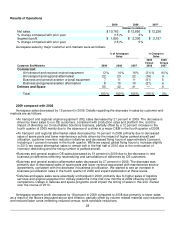
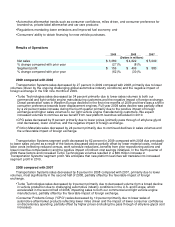
Results of Operations
2009 2008 2007
(Dollars in millions)
Net sales $ 4,144 $ 5,266 $ 4,866
% change compared with prior year (21)% 8% 5%
Segment profit $ 605 $ 721 $ 658
% change compared with prior year (16)% 10% 16%
2009 compared with 2008
Specialty Materials sales decreased by 21 percent in 2009 compared to 2008 primarily driven by (i) a 32
percent decrease in Resins and Chemicals sales due to substantial price declines arising from pass through of
lower raw materials costs, partially offset by increased volume (most notably in the fourth quarter), (ii) a 19
percent decrease in UOP sales due to customer deferrals of projects as a result of reduced demand for
additional capacity in the refining and petrochemical industries as well as lower catalyst sales, (iii) a 22 percent
decrease in Specialty Products sales most significantly due to continued demand softness across key customer
end-markets, and (iv) an 11 percent decrease in Fluorine Products sales due to lower volume sales of
refrigerants and insulating materials principally driven by customer inventory reduction initiatives and soft
construction and original equipment manufacturing end markets, partially offset by price increases.
Specialty Materials segment profit decreased by 16 percent in 2009 compared with 2008. This decrease is
principally due to lower sales as a result of the factors discussed above, partially offset by lower material costs,
reduced labor costs (reflecting reduced census, work schedule reductions and lower incentive compensation),
the positive impact of indirect cost savings initiatives and increased prices. In the fourth quarter of 2009 these
factors more than offset the impact of lower sales described above resulting in a 56 percent increase in segment
profit.
2008 compared with 2007
Specialty Materials sales increased by 8 percent in 2008 compared to 2007 primarily driven by (i) increased
pricing reflecting the pass-through of higher raw material costs and other pricing actions (including benefits from
formula based pricing arrangements), most significantly in Resins and
32