Honeywell 2009 Annual Report Download - page 38
Download and view the complete annual report
Please find page 38 of the 2009 Honeywell annual report below. You can navigate through the pages in the report by either clicking on the pages listed below, or by using the keyword search tool below to find specific information within the annual report.-
 1
1 -
2
-
3
-
4
-
5
-
6
-
7
-
8
-
9
-
10
-
11
-
12
-
13
-
14
-
15
-
16
-
17
-
18
-
19
-
20
-
21
-
22
-
23
-
24
-
25
-
26
-
27
-
 28
28 -
 29
29 -
 30
30 -
 31
31 -
 32
32 -
 33
33 -
 34
34 -
 35
35 -
 36
36 -
 37
37 -
 38
38 -
 39
39 -
 40
40 -
 41
41 -
 42
42 -
 43
43 -
 44
44 -
 45
45 -
 46
46 -
 47
47 -
 48
48 -
49
-
50
-
51
-
52
-
53
-
54
-
55
-
56
-
57
-
58
-
59
-
60
-
61
-
62
-
63
-
64
-
65
-
66
-
67
-
68
-
69
-
70
-
71
-
72
-
73
-
74
-
75
-
76
-
77
-
78
-
79
-
80
-
81
-
82
-
83
-
84
-
85
-
86
-
87
-
88
-
89
-
90
-
91
-
92
-
93
-
94
-
95
-
96
-
97
-
98
-
99
-
100
-
101
-
102
-
103
-
104
-
105
-
106
-
107
-
108
-
109
-
110
-
111
-
112
-
113
-
114
-
115
-
116
-
117
-
118
-
119
-
120
-
121
-
122
-
123
-
124
-
125
-
126
-
127
-
128
-
129
-
130
-
131
-
132
-
133
-
134
-
135
-
136
-
137
-
138
-
139
-
140
-
141
-
142
-
143
-
144
-
145
-
146
-
147
-
148
-
149
-
150
-
151
-
152
-
153
-
154
-
155
-
156
-
157
-
158
-
159
-
160
-
161
-
162
-
163
-
164
-
165
-
166
-
167
-
168
-
169
-
170
-
171
-
172
-
173
-
174
-
175
-
176
-
177
-
178
-
179
-
180
 |
 |

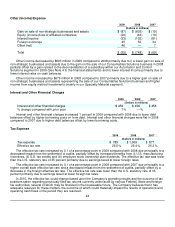
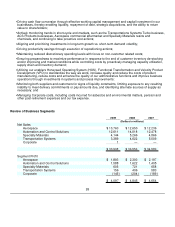
A reconciliation of segment profit to income from continuing operations before taxes follows:
2009 2008 2007
(Dollars in millions)
Segment profit $ 4,097 $ 4,845 $ 4,654
Other income (expense)(1) 29 685 69
Interest and other financial charges (459) (456) (456)
Stock compensation expense(2),(3) (118) (128) (65)
Pension and other postretirement benefits expense(2) (93) (113) (322)
Repositioning and other charges(2) (478) (1,012) (543)
Income from continuing operations before taxes $ 2,978 $ 3,821 $ 3,337
(1) Equity income/(loss) of affiliated companies was included in Segment Profit, on a prospective basis,
commencing January 1, 2008. Other income/(expense) as presented above includes equity income of
affiliated companies of $10 million for the year ended December 31, 2007.
(2)
Amounts included in cost of products and services sold and selling, general and administrative expenses.
(3)
Costs associated with restricted stock units ("RSU") were excluded from Segment Profit, on a prospective
basis, commencing January 1, 2008. Stock compensation expense, including RSU expense, totaled $112
million for the year ended December 31, 2007. Stock option expense is included for all periods presented.
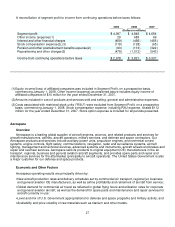
Aerospace
Overview
Aerospace is a leading global supplier of aircraft engines, avionics, and related products and services for
aircraft manufacturers, airlines, aircraft operators, military services, and defense and space contractors. Our
Aerospace products and services include auxiliary power units, propulsion engines, environmental control
systems, engine controls, flight safety, communications, navigation, radar and surveillance systems, aircraft
lighting, management and technical services, advanced systems and instruments, aircraft wheels and brakes and
repair and overhaul services. Aerospace sells its products to original equipment (OE) manufacturers in the air
transport, regional, business and general aviation aircraft segments, and provides spare parts and repair and
maintenance services for the aftermarket (principally to aircraft operators). The United States Government is also
a major customer for our defense and space products.
Economic and Other Factors
Aerospace operating results are principally driven by:
• New aircraft production rates and delivery schedules set by commercial air transport, regional jet, business
and general aviation OE manufacturers, as well as airline profitability and retirement of aircraft from service;
•
Global demand for commercial air travel as reflected in global flying hours and utilization rates for corporate
and general aviation aircraft, as well as the demand for spare parts and maintenance and repair services for
aircraft currently in use;
•
Level and mix of U.S. Government appropriations for defense and space programs and military activity; and
•
Availability and price volatility of raw materials such as titanium and other metals.
27