Honeywell 2009 Annual Report Download - page 101
Download and view the complete annual report
Please find page 101 of the 2009 Honeywell annual report below. You can navigate through the pages in the report by either clicking on the pages listed below, or by using the keyword search tool below to find specific information within the annual report.-
 1
1 -
2
-
3
-
4
-
5
-
6
-
7
-
8
-
9
-
10
-
11
-
12
-
13
-
14
-
15
-
16
-
17
-
18
-
19
-
20
-
21
-
22
-
23
-
24
-
25
-
26
-
27
-
28
-
29
-
30
-
31
-
32
-
33
-
34
-
35
-
36
-
37
-
38
-
39
-
40
-
41
-
42
-
43
-
44
-
45
-
46
-
47
-
48
-
49
-
50
-
51
-
52
-
53
-
54
-
55
-
56
-
57
-
58
-
59
-
60
-
61
-
62
-
63
-
64
-
65
-
66
-
67
-
68
-
69
-
70
-
71
-
72
-
73
-
74
-
75
-
76
-
77
-
78
-
79
-
80
-
81
-
82
-
83
-
84
-
85
-
86
-
87
-
88
-
89
-
90
-
 91
91 -
 92
92 -
 93
93 -
 94
94 -
 95
95 -
 96
96 -
 97
97 -
 98
98 -
 99
99 -
 100
100 -
 101
101 -
 102
102 -
 103
103 -
 104
104 -
 105
105 -
 106
106 -
 107
107 -
 108
108 -
 109
109 -
 110
110 -
 111
111 -
112
-
113
-
114
-
115
-
116
-
117
-
118
-
119
-
120
-
121
-
122
-
123
-
124
-
125
-
126
-
127
-
128
-
129
-
130
-
131
-
132
-
133
-
134
-
135
-
136
-
137
-
138
-
139
-
140
-
141
-
142
-
143
-
144
-
145
-
146
-
147
-
148
-
149
-
150
-
151
-
152
-
153
-
154
-
155
-
156
-
157
-
158
-
159
-
160
-
161
-
162
-
163
-
164
-
165
-
166
-
167
-
168
-
169
-
170
-
171
-
172
-
173
-
174
-
175
-
176
-
177
-
178
-
179
-
180
 |
 |

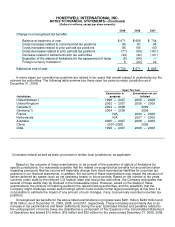
HONEYWELL INTERNATIONAL INC.
NOTES TO FINANCIAL STATEMENTS—(Continued)
(Dollars in millions, except per share amounts)
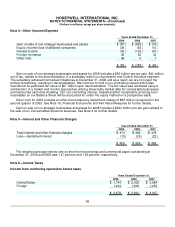
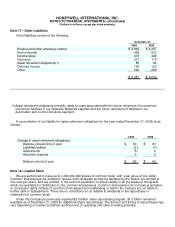
Depreciation expense was $707, $702 and $675 million in 2009, 2008 and 2007, respectively.
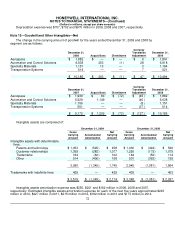
Note 12—Goodwill and Other Intangibles—Net
The change in the carrying amount of goodwill for the years ended December 31, 2009 and 2008 by
segment are as follows:
December 31,
2008 Acquisitions Divestitures
Currency
Translation
Adjustment December 31,
2009
Aerospace $ 1,882 $ — $ — $ 9 $ 1,891
Automation and Control Solutions 6,638 253 (1) 28 6,918
Specialty Materials 1,151 10 — 3 1,164
Transportation Systems 514 — — 7 521
$ 10,185 $ 263 $ (1) $ 47 $ 10,494
December 31,
2007 Acquisitions Divestitures
Currency
Translation
Adjustment December 31,
2008
Aerospace $ 1,939 $ 60 $ (72) $ (45) $ 1,882
Automation and Control Solutions 5,529 1,149 — (40) 6,638
Specialty Materials 1,156 — — (5) 1,151
Transportation Systems 551 — — (37) 514
$ 9,175 $ 1,209 $ (72) $ (127) $ 10,185
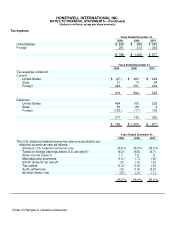
Intangible assets are comprised of:
December 31, 2009 December 31, 2008
Gross
Carrying
Amount Accumulated
Amortization
Net
Carrying
Amount
Gross
Carrying
Amount Accumulated
Amortization
Net
Carrying
Amount
Intangible assets with determinable
lives:
Patents and technology $ 1,053 $ (595) $ 458 $ 1,030 $ (494) $ 536
Customer relationships 1,359 (282) 1,077 1,250 (175) 1,075
Trademarks 164 (62) 102 164 (50) 114
Other 514 (406) 108 501 (362) 139
3,090 (1,345) 1,745 2,945 (1,081) 1,864
Trademarks with indefinite lives 429 — 429 403 — 403
$ 3,519 $ (1,345) $ 2,174 $ 3,348 $ (1,081) $ 2,267
Intangible assets amortization expense was $250, $201 and $162 million in 2009, 2008 and 2007,
respectively. Estimated intangible assets amortization expense for each of the next five years approximates $245
million in 2010, $227 million in 2011, $215 million in 2012, $192 million in 2013 and $173 million in 2014.
72