Honeywell 2009 Annual Report Download - page 34
Download and view the complete annual report
Please find page 34 of the 2009 Honeywell annual report below. You can navigate through the pages in the report by either clicking on the pages listed below, or by using the keyword search tool below to find specific information within the annual report.-
 1
1 -
2
-
3
-
4
-
5
-
6
-
7
-
8
-
9
-
10
-
11
-
12
-
13
-
14
-
15
-
16
-
17
-
18
-
19
-
20
-
21
-
22
-
23
-
 24
24 -
 25
25 -
 26
26 -
 27
27 -
 28
28 -
 29
29 -
 30
30 -
 31
31 -
 32
32 -
 33
33 -
 34
34 -
 35
35 -
 36
36 -
 37
37 -
 38
38 -
 39
39 -
 40
40 -
 41
41 -
 42
42 -
 43
43 -
 44
44 -
45
-
46
-
47
-
48
-
49
-
50
-
51
-
52
-
53
-
54
-
55
-
56
-
57
-
58
-
59
-
60
-
61
-
62
-
63
-
64
-
65
-
66
-
67
-
68
-
69
-
70
-
71
-
72
-
73
-
74
-
75
-
76
-
77
-
78
-
79
-
80
-
81
-
82
-
83
-
84
-
85
-
86
-
87
-
88
-
89
-
90
-
91
-
92
-
93
-
94
-
95
-
96
-
97
-
98
-
99
-
100
-
101
-
102
-
103
-
104
-
105
-
106
-
107
-
108
-
109
-
110
-
111
-
112
-
113
-
114
-
115
-
116
-
117
-
118
-
119
-
120
-
121
-
122
-
123
-
124
-
125
-
126
-
127
-
128
-
129
-
130
-
131
-
132
-
133
-
134
-
135
-
136
-
137
-
138
-
139
-
140
-
141
-
142
-
143
-
144
-
145
-
146
-
147
-
148
-
149
-
150
-
151
-
152
-
153
-
154
-
155
-
156
-
157
-
158
-
159
-
160
-
161
-
162
-
163
-
164
-
165
-
166
-
167
-
168
-
169
-
170
-
171
-
172
-
173
-
174
-
175
-
176
-
177
-
178
-
179
-
180
 |
 |

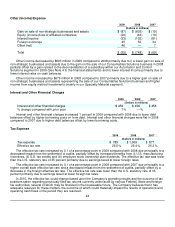
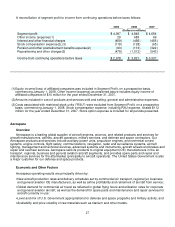
Other (Income)/Expense
2009 2008 2007
(Dollars in millions)
Gain on sale of non-strategic businesses and assets $ (87) $ (635) $ (19)
Equity (income)/loss of affiliated companies (26) (63) (10)
Interest income (33) (102) (81)
Foreign exchange 45 52 34
Other (net) 46 — 7
Total $ (55) $ (748) $ (69)
Other income decreased by $693 million in 2009 compared to 2008 primarily due to i) a lower gain on sale of
non-strategic businesses and assets due to the gain on the sale of our Consumables Solutions business in 2008
partially offset by a gain related to the deconsolidation of a subsidiary within our Automation and Control
Solutions segment in 2009 (See Note 4 to the financial statements) and ii) lower interest income primarily due to
lower interest rates on cash balances.
Other income increased by $679 million in 2008 compared to 2007 primarily due to a higher gain on sale of
non-strategic businesses and assets representing the sale of our Consumables Solutions business and higher
income from equity method investments (mainly in our Specialty Material segment).
Interest and Other Financial Charges
2009 2008 2007
(Dollars in millions)
Interest and other financial charges $ 459 $ 456 $ 456
% change compared with prior year 1% —%
Interest and other financial charges increased 1 percent in 2009 compared with 2008 due to lower debt
balances offset by higher borrowing costs on term debt. Interest and other financial charges were flat in 2008
compared to 2007 due to higher debt balances offset by lower borrowing costs.
Tax Expense
2009 2008 2007
(Dollars in millions)
Tax expense $ 789 $ 1,009 $ 877
Effective tax rate 26.5% 26.4% 26.3%
The effective tax rate increased by 0.1 of a percentage point in 2009 compared with 2008 due principally to a
decreased impact from the settlement of audits, partially offset by increased benefits from (i) U.S. manufacturing
incentives, (ii) U.S. tax credits and (iii) employee stock ownership plan dividends. The effective tax rate was lower
than the U.S. statutory rate of 35 percent primarily due to earnings taxed at lower foreign rates.
The effective tax rate increased by 0.1 of a percentage point in 2008 compared with 2007 due principally to a
higher overall state effective tax rate and a decreased impact from the settlement of audits, partially offset by a
decrease in the foreign effective tax rate. The effective tax rate was lower than the U.S. statutory rate of 35
percent primarily due to earnings taxed at lower foreign tax rates.
In 2010, the effective tax could change based upon the Company's operating results and the outcome of tax
positions taken regarding previously filed tax returns currently under audit by various Federal, State and foreign
tax authorities, several of which may be finalized in the foreseeable future. The Company believes that it has
adequate reserves for these matters, the outcome of which could materially impact the results of operations and
operating cash flows in the period they are resolved.
24