Honeywell 2009 Annual Report Download - page 33
Download and view the complete annual report
Please find page 33 of the 2009 Honeywell annual report below. You can navigate through the pages in the report by either clicking on the pages listed below, or by using the keyword search tool below to find specific information within the annual report.-
 1
1 -
2
-
3
-
4
-
5
-
6
-
7
-
8
-
9
-
10
-
11
-
12
-
13
-
14
-
15
-
16
-
17
-
18
-
19
-
20
-
21
-
22
-
 23
23 -
 24
24 -
 25
25 -
 26
26 -
 27
27 -
 28
28 -
 29
29 -
 30
30 -
 31
31 -
 32
32 -
 33
33 -
 34
34 -
 35
35 -
 36
36 -
 37
37 -
 38
38 -
 39
39 -
 40
40 -
 41
41 -
 42
42 -
 43
43 -
44
-
45
-
46
-
47
-
48
-
49
-
50
-
51
-
52
-
53
-
54
-
55
-
56
-
57
-
58
-
59
-
60
-
61
-
62
-
63
-
64
-
65
-
66
-
67
-
68
-
69
-
70
-
71
-
72
-
73
-
74
-
75
-
76
-
77
-
78
-
79
-
80
-
81
-
82
-
83
-
84
-
85
-
86
-
87
-
88
-
89
-
90
-
91
-
92
-
93
-
94
-
95
-
96
-
97
-
98
-
99
-
100
-
101
-
102
-
103
-
104
-
105
-
106
-
107
-
108
-
109
-
110
-
111
-
112
-
113
-
114
-
115
-
116
-
117
-
118
-
119
-
120
-
121
-
122
-
123
-
124
-
125
-
126
-
127
-
128
-
129
-
130
-
131
-
132
-
133
-
134
-
135
-
136
-
137
-
138
-
139
-
140
-
141
-
142
-
143
-
144
-
145
-
146
-
147
-
148
-
149
-
150
-
151
-
152
-
153
-
154
-
155
-
156
-
157
-
158
-
159
-
160
-
161
-
162
-
163
-
164
-
165
-
166
-
167
-
168
-
169
-
170
-
171
-
172
-
173
-
174
-
175
-
176
-
177
-
178
-
179
-
180
 |
 |

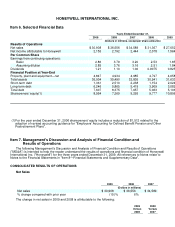
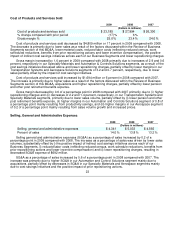
Cost of Products and Services Sold
2009 2008 2007
(Dollars in millions)
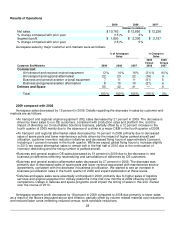
Cost of products and services sold $ 23,185 $ 27,994 $ 26,300
% change compared with prior period (17)% 6%
Gross margin % 25.0% 23.4% 24.0%
Cost of products and services sold decreased by $4,809 million or 17 percent in 2009 compared with 2008.
The decrease is primarily due to lower sales as a result of the factors discussed within the Review of Business
Segments section of this MD&A, lower material costs, reduced labor costs (reflecting reduced census, work
scheduled reductions, benefits from prior repositioning actions and lower incentive compensation), the positive
impact of indirect cost savings initiatives across each of our Business Segments and lower repositioning charges.
Gross margin increased by 1.6 percent in 2009 compared with 2008 primarily due to increases of 2.9 and 0.6
percent, respectively in our Specialty Materials and Automation & Controls Solutions segments, as a result of the
cost savings initiatives discussed above and lower repositioning charges, partially offset by lower margins in our
Transportation Systems and Aerospace Solutions segments of 3.2 and 0.7 percent, respectively, due to lower
sales partially offset by the impact of cost savings initiatives.
Cost of products and services sold increased by $1,694 million or 6 percent in 2008 compared with 2007.
The increase is primarily due to higher sales as a result of the factors discussed within the Review of Business
Segments section of this MD&A, acquisitions and higher repositioning charges, partially offset by lower pension
and other post retirement benefits expense.
Gross margin decreased by 0.6 of a percentage point in 2008 compared with 2007 primarily due to (i) higher
repositioning charges and (ii) decreases of 2.2 and 1.4 percent, respectively, in our Transportation Systems and
Specialty Materials segments, primarily due to lower sales volume, partially offset by (i) lower pension and other
post retirement benefits expense, (ii) higher margins in our Automation and Controls Solutions segment of 0.8 of
a percentage point mainly resulting from productivity savings, and (iii) higher margins in our Aerospace segment
of 0.2 of a percentage point mainly resulting from sales volume growth and increased prices.
Selling, General and Administrative Expenses
2009 2008 2007
(Dollars in millions)
Selling, general and administrative expenses $ 4,341 $ 5,033 $ 4,565
Percent of sales 14.0% 13.8% 13.2%
Selling general and administrative expenses (SG&A) as a percentage of sales increased by 0.2 of a
percentage point in 2009 compared with 2008. The increase as a percentage of sales was driven by lower sales
volumes, substantially offset by i) the positive impact of indirect cost savings initiatives across each of our
Business Segments, ii) reduced labor costs (reflecting reduced census, work schedule reductions, benefits from
prior repositioning actions and lower incentive compensation) and iii) lower repositioning charges, resulting in
decreased SG&A expense of $692 million.
SG&A as a percentage of sales increased by 0.6 of a percentage point in 2008 compared with 2007. The
increase was primarily due to higher SG&A in our Automation and Control Solutions segment mainly due to
acquisitions, partially offset by decreases in SG&A in our Specialty Materials and Aerospace segments mainly
due to cost savings initiatives and the positive impact of prior repositioning actions.
23