Honeywell 2009 Annual Report Download - page 40
Download and view the complete annual report
Please find page 40 of the 2009 Honeywell annual report below. You can navigate through the pages in the report by either clicking on the pages listed below, or by using the keyword search tool below to find specific information within the annual report.-
 1
1 -
2
-
3
-
4
-
5
-
6
-
7
-
8
-
9
-
10
-
11
-
12
-
13
-
14
-
15
-
16
-
17
-
18
-
19
-
20
-
21
-
22
-
23
-
24
-
25
-
26
-
27
-
28
-
29
-
 30
30 -
 31
31 -
 32
32 -
 33
33 -
 34
34 -
 35
35 -
 36
36 -
 37
37 -
 38
38 -
 39
39 -
 40
40 -
 41
41 -
 42
42 -
 43
43 -
 44
44 -
 45
45 -
 46
46 -
 47
47 -
 48
48 -
 49
49 -
 50
50 -
51
-
52
-
53
-
54
-
55
-
56
-
57
-
58
-
59
-
60
-
61
-
62
-
63
-
64
-
65
-
66
-
67
-
68
-
69
-
70
-
71
-
72
-
73
-
74
-
75
-
76
-
77
-
78
-
79
-
80
-
81
-
82
-
83
-
84
-
85
-
86
-
87
-
88
-
89
-
90
-
91
-
92
-
93
-
94
-
95
-
96
-
97
-
98
-
99
-
100
-
101
-
102
-
103
-
104
-
105
-
106
-
107
-
108
-
109
-
110
-
111
-
112
-
113
-
114
-
115
-
116
-
117
-
118
-
119
-
120
-
121
-
122
-
123
-
124
-
125
-
126
-
127
-
128
-
129
-
130
-
131
-
132
-
133
-
134
-
135
-
136
-
137
-
138
-
139
-
140
-
141
-
142
-
143
-
144
-
145
-
146
-
147
-
148
-
149
-
150
-
151
-
152
-
153
-
154
-
155
-
156
-
157
-
158
-
159
-
160
-
161
-
162
-
163
-
164
-
165
-
166
-
167
-
168
-
169
-
170
-
171
-
172
-
173
-
174
-
175
-
176
-
177
-
178
-
179
-
180
 |
 |

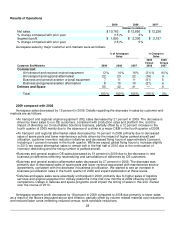
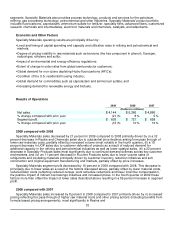
Results of Operations
2009 2008 2007
(Dollars in millions)
Net sales $ 10,763 $ 12,650 $ 12,236
% change compared with prior year (15)% 3%
Segment profit $ 1,893 $ 2,300 $ 2,197
% change compared with prior year (18)% 5%
Aerospace sales by major customer end-markets were as follows:
Customer End-Markets
% of Aerospace
Sales % Change in
Sales
2009 2008 2007
2009
Versus
2008
2008
Versus
2007
Commercial:
Air transport and regional original equipment 13% 14% 16% (21)% (6)%
Air transport and regional aftermarket 22 23 22 (16) 4
Business and general aviation original equipment 7 11 11 (51) 5
Business and general aviation aftermarket 8 10 10 (27) 6
Defense and Space 50 42 41 — 6
Total 100% 100% 100% (15)% 3%
2009 compared with 2008
Aerospace sales decreased by 15 percent in 2009. Details regarding the decrease in sales by customer end-
markets are as follows:
• Air transport and regional original equipment (OE) sales decreased by 21 percent in 2009. The decrease is
driven by lower sales to our OE customers, consistent with production rates and platform mix, and the
impact of divesting our Consumables Solutions business, partially offset by a 12 percent increase in the
fourth quarter of 2009 mainly due to the absence of a strike at a major OEM in the fourth quarter of 2008.
•
Air transport and regional aftermarket sales decreased by 16 percent in 2009 primarily due to decreased
sales of spare parts and lower maintenance activity driven by the impact of higher parked aircraft part
utilization, customer inventory reduction initiatives and decreased flying hours of approximately 2 percent,
including a 1 percent increase in the fourth quarter. While we expect global flying hours to increase slightly
in 2010, we expect aftermarket sales to remain soft in the first half of 2010 due to the continuation of
inventory destocking and the rising number of parked aircraft.
•
Business and general aviation OE sales decreased by 51 percent in 2009 due to the decrease in new
business jet deliveries reflecting rescheduling and cancellations of deliveries by OE customers.
•
Business and general aviation aftermarket sales decreased by 27 percent in 2009. The decrease was
primarily due to decreased sales of spare parts and lower revenue associated with maintenance service
agreements, consistent with the decrease in business jet utilization. We started to see an increase in
business jet utilization rates in the fourth quarter of 2009 and expect stabilization at these levels.
•
Defense and space sales were essentially unchanged in 2009, primarily due to higher sales of logistics
services and original equipment for military platforms in the first nine months of 2009 offset by program
completions. Delays in defense and space programs could impact the timing of sales in this end- market
over the course of 2010.
Aerospace segment profit decreased by 18 percent in 2009 compared to 2008 due primarily to lower sales
as a result of the factors discussed above and inflation, partially offset by volume related material cost reductions
and reduced labor costs (reflecting reduced census, work schedule reductions,
28