Honeywell 2009 Annual Report Download - page 134
Download and view the complete annual report
Please find page 134 of the 2009 Honeywell annual report below. You can navigate through the pages in the report by either clicking on the pages listed below, or by using the keyword search tool below to find specific information within the annual report.-
 1
1 -
2
-
3
-
4
-
5
-
6
-
7
-
8
-
9
-
10
-
11
-
12
-
13
-
14
-
15
-
16
-
17
-
18
-
19
-
20
-
21
-
22
-
23
-
24
-
25
-
26
-
27
-
28
-
29
-
30
-
31
-
32
-
33
-
34
-
35
-
36
-
37
-
38
-
39
-
40
-
41
-
42
-
43
-
44
-
45
-
46
-
47
-
48
-
49
-
50
-
51
-
52
-
53
-
54
-
55
-
56
-
57
-
58
-
59
-
60
-
61
-
62
-
63
-
64
-
65
-
66
-
67
-
68
-
69
-
70
-
71
-
72
-
73
-
74
-
75
-
76
-
77
-
78
-
79
-
80
-
81
-
82
-
83
-
84
-
85
-
86
-
87
-
88
-
89
-
90
-
91
-
92
-
93
-
94
-
95
-
96
-
97
-
98
-
99
-
100
-
101
-
102
-
103
-
104
-
105
-
106
-
107
-
108
-
109
-
110
-
111
-
112
-
113
-
114
-
115
-
116
-
117
-
118
-
119
-
120
-
121
-
122
-
123
-
 124
124 -
 125
125 -
 126
126 -
 127
127 -
 128
128 -
 129
129 -
 130
130 -
 131
131 -
 132
132 -
 133
133 -
 134
134 -
 135
135 -
 136
136 -
 137
137 -
 138
138 -
 139
139 -
 140
140 -
 141
141 -
 142
142 -
 143
143 -
 144
144 -
145
-
146
-
147
-
148
-
149
-
150
-
151
-
152
-
153
-
154
-
155
-
156
-
157
-
158
-
159
-
160
-
161
-
162
-
163
-
164
-
165
-
166
-
167
-
168
-
169
-
170
-
171
-
172
-
173
-
174
-
175
-
176
-
177
-
178
-
179
-
180
 |
 |

HONEYWELL INTERNATIONAL INC.
NOTES TO FINANCIAL STATEMENTS—(Continued)
(Dollars in millions, except per share amounts)
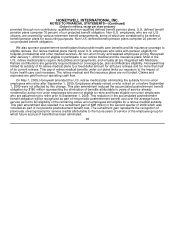
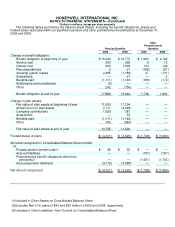
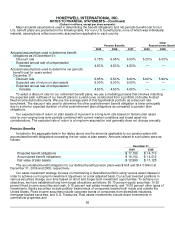
Major actuarial assumptions used in determining the benefit obligations and net periodic benefit cost for our
U.S. benefit plans are presented in the following table. For non-U.S. benefit plans, none of which was individually
material, assumptions reflect economic assumptions applicable to each country.
Pension Benefits Other
Postretirement Benefits
2009 2008 2007 2009 2008
Actuarial assumptions used to determine benefit
obligations as of December 31:
Discount rate 5.75% 6.95% 6.50% 5.25% 6.00% 5.90
Expected annual rate of compensation
increase 4.50% 4.50% 4.50% — —
Actuarial assumptions used to determine net periodic
benefit cost for years ended
December 31:
Discount rate 6.95% 6.50% 6.00% 6.00% 5.90% 5.70
Expected rate of return on plan assets 9.00% 9.00% 9.00% — —
Expected annual rate of compensation
increase 4.50% 4.50% 4.00% — —
To select a discount rate for our retirement benefit plans, we use a modeling process that involves matching
the expected cash outflows of our benefit plans to a yield curve constructed from a portfolio of double A rated
fixed-income debt instruments. We use the average yield of this hypothetical portfolio as a discount rate
benchmark. The discount rate used to determine the other postretirement benefit obligation is lower principally
due to a shorter expected duration of other postretirement plan obligations as compared to pension plan
obligations.
Our expected rate of return on plan assets of 9 percent is a long-term rate based on historic plan asset
returns over varying long-term periods combined with current market conditions and broad asset mix
considerations. The expected rate of return is a long-term assumption and generally does not change annually.
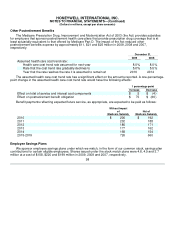
Pension Benefits
Included in the aggregate data in the tables above are the amounts applicable to our pension plans with
accumulated benefit obligations exceeding the fair value of plan assets. Amounts related to such plans were as
follows:
December 31,
2009 2008
Projected benefit obligations $ 17,159 $ 14,713
Accumulated benefit obligations $ 16,102 $ 14,012
Fair value of plan assets $ 12,999 $ 11,125
The accumulated benefit obligation for our defined benefit pension plans was $16.8 and $14.3 billion at
December 31, 2009 and 2008, respectively.
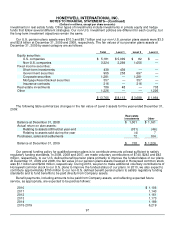
Our asset investment strategy focuses on maintaining a diversified portfolio using various asset classes in
order to achieve our long-term investment objectives on a risk adjusted basis. Our actual invested positions in
various securities change over time based on short and longer-term investment opportunities. To achieve our
objectives, we have established long-term target allocations as follows: 60-70 percent equity securities, 10-20
percent fixed income securities and cash, 5-15 percent real estate investments, and 10-20 percent other types of
investments. Equity securities include publicly-traded stock of companies located both inside and outside the
United States. Fixed income securities include corporate bonds of companies from diversified industries,
mortgage-backed securities, and U.S. Treasuries. Real estate investments include direct investments in
commercial properties and
96