Honeywell 2009 Annual Report Download - page 116
Download and view the complete annual report
Please find page 116 of the 2009 Honeywell annual report below. You can navigate through the pages in the report by either clicking on the pages listed below, or by using the keyword search tool below to find specific information within the annual report.-
 1
1 -
2
-
3
-
4
-
5
-
6
-
7
-
8
-
9
-
10
-
11
-
12
-
13
-
14
-
15
-
16
-
17
-
18
-
19
-
20
-
21
-
22
-
23
-
24
-
25
-
26
-
27
-
28
-
29
-
30
-
31
-
32
-
33
-
34
-
35
-
36
-
37
-
38
-
39
-
40
-
41
-
42
-
43
-
44
-
45
-
46
-
47
-
48
-
49
-
50
-
51
-
52
-
53
-
54
-
55
-
56
-
57
-
58
-
59
-
60
-
61
-
62
-
63
-
64
-
65
-
66
-
67
-
68
-
69
-
70
-
71
-
72
-
73
-
74
-
75
-
76
-
77
-
78
-
79
-
80
-
81
-
82
-
83
-
84
-
85
-
86
-
87
-
88
-
89
-
90
-
91
-
92
-
93
-
94
-
95
-
96
-
97
-
98
-
99
-
100
-
101
-
102
-
103
-
104
-
105
-
 106
106 -
 107
107 -
 108
108 -
 109
109 -
 110
110 -
 111
111 -
 112
112 -
 113
113 -
 114
114 -
 115
115 -
 116
116 -
 117
117 -
 118
118 -
 119
119 -
 120
120 -
 121
121 -
 122
122 -
 123
123 -
 124
124 -
 125
125 -
 126
126 -
127
-
128
-
129
-
130
-
131
-
132
-
133
-
134
-
135
-
136
-
137
-
138
-
139
-
140
-
141
-
142
-
143
-
144
-
145
-
146
-
147
-
148
-
149
-
150
-
151
-
152
-
153
-
154
-
155
-
156
-
157
-
158
-
159
-
160
-
161
-
162
-
163
-
164
-
165
-
166
-
167
-
168
-
169
-
170
-
171
-
172
-
173
-
174
-
175
-
176
-
177
-
178
-
179
-
180
 |
 |

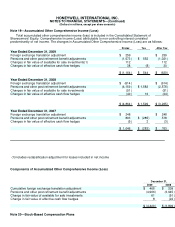
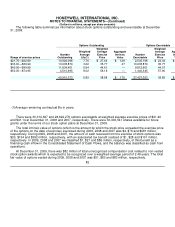
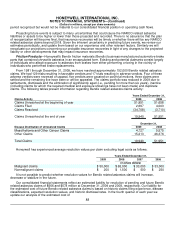
HONEYWELL INTERNATIONAL INC.
NOTES TO FINANCIAL STATEMENTS—(Continued)
(Dollars in millions, except per share amounts)
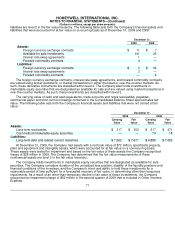
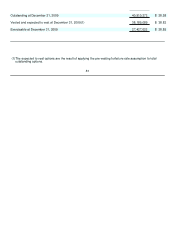
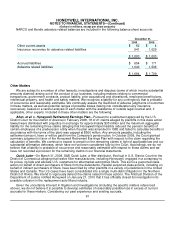
The following table summarizes information about stock options outstanding and exercisable at December
31, 2009:
Range of exercise prices
Options Outstanding Options Exercisable
Number
Outstanding
Weighted
Average
Life(1)
Weighted
Average
Exercise
Price
Aggregate
Intrinsic
Value Number
Exercisable
Weighted
Average
Exercise
Price
Aggregate
Intrinsic
Value
$21.75—$32.99 10,926,098 7.76 $ 27.46 $ 128 2,535,198 $ 24.34 $
$33.00—$39.99 13,638,879 3.62 35.77 47 13,638,879 35.77
$40.00—$49.99 11,834,401 5.94 44.61 — 9,812,601 44.07
$50.00—$74.95 4,510,995 8.02 58.18 — 1,440,345 57.90
40,910,373 5.89 38.58 $ 175 27,427,023 38.85 $
(1) Average remaining contractual life in years.
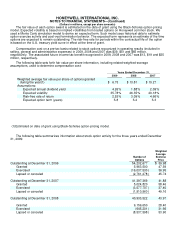
There were 30,314,667 and 28,624,279 options exercisable at weighted average exercise prices of $41.40
and $41.14 at December 31, 2008 and 2007, respectively. There were 30,000,541 shares available for future
grants under the terms of our stock option plans at December 31, 2009.
The total intrinsic value of options (which is the amount by which the stock price exceeded the exercise price
of the options on the date of exercise) exercised during 2009, 2008 and 2007 was $4, $76 and $281 million,
respectively. During 2009, 2008 and 2007, the amount of cash received from the exercise of stock options was
$20, $134 and $592 million, respectively, with an associated tax benefit realized of $1, $28 and $101 million,
respectively. In 2009, 2008 and 2007 we classified $1, $21 and $86 million, respectively, of this benefit as a
financing cash inflow in the Consolidated Statement of Cash Flows, and the balance was classified as cash from
operations.
At December 31, 2009, there was $82 million of total unrecognized compensation cost related to non-vested
stock option awards which is expected to be recognized over a weighted-average period of 2.49 years. The total
fair value of options vested during 2009, 2008 and 2007 was $51, $63 and $83 million, respectively.
82